Technology
Services
Resources
Whatever your goal may be—training for a marathon, saving for a house, or developing a character in Red Dead Redemption (hey, goals come in all shapes and sizes!)—there’s probably a tool out there to help you visualize your progress.
If you’ve ever used a Fitbit, for example, you’re well-acquainted with their dashboard. Colorful, easy-to-understand metrics visualizations track how many steps, hours of sleep, and glasses of water you’ve accrued—not just on a day-to-day basis, but week-over-week, month-over-month, and so on. The Fitbit dashboard makes it easy for users to identify where they have seen success and what they may want to work on going forward. Plus, seeing those line graphs steadily increase over time is pretty darn motivating.
While consumers are used to integrated reporting dashboards like Fitbit’s in their daily lives, media professionals are typically not so lucky. But automated reporting and visual dashboards have many benefits for marketers—particularly when it comes to client communications.
Marketers have access to an ever-growing list of channels and formats with which to spread their clients’ core messages. However, with those increased options has come increased complexity: according to a recent report from Advertiser Perceptions, advertisers use an average of nine platforms per campaign—and six in an average day. This ever-growing media fragmentation saddles digital advertisers with the unenviable task of unifying many disparate data sets.
Those without access to automated reporting must download multiple files, sort out the data points they’re interested in, create graphs and charts, and put together presentations from scratch—for all the different clients they serve. Stitching together those data sets is time-consuming and unfulfilling for marketers, and it means more manual errors, inconsistencies, and redundancies for clients. With low confidence in their analytics, agencies can’t glean the insights they need to come up with winning strategies.
At the same time, robust and easy-to-understand campaign insights are increasingly “must haves” for brands. Economic upheavals including war, supply chain disruption, and inflation have put brand loyalty very much at stake; while the proliferation of mis- and dis-information online threatens brand safety. Those brands who can stay data-driven and nimble with their marketing as the digital advertising industry churns will be best-positioned to maintain consumer trust and loyalty.
Still, in one study, about 60% of US agency and brand professionals cited a lack of transparency as a strong threat to digital ad budgets. This lack of transparency impairs brands’ ability to build their strategies from solid data—and hinders client relationships before the first campaign kickoff meeting is even scheduled.
Is it high time for the media buying industry to leave manual reporting behind? Signs point to yes. But what can agencies replace it with? Simple: business intelligence and reporting automation, technologies that unify data sets across channels like search, social, and programmatic.
Consolidating campaign information into—and generating reports from—one central place not only boosts data confidence and empowers marketers to tell their most creative, well-informed brand stories, but also reduces the time they have to spend on manual and repetitive tasks. And in the context of the Great Resignation, reducing manual labor wherever possible is critical to avoiding high rates of costly employee turnover.
Automated report dashboards can be particularly impactful. As marketers know well, visuals are key to quickly and clearly telling a story. Turns out, this is as true for behind-the-scenes marketing operations as it is for a simple display ad.
Visualization helps even the most experienced professionals make better sense of data. In one experiment performed by a cognitive psychologist and a behavioral scientist, two groups of economists were asked to determine the odds of different outcomes based on a regression analysis. The economists who were provided data in text form got most of their answers wrong. The economists who were given a scatterplot, on the other hand, performed markedly better. In the same way, visual dashboards empower marketers and clients alike to find patterns in data they trust.
Even more, automated report dashboards are often “always-on;” in that users who are given access can see the dashboards any time. So if a certain client representative wants to check in on how their campaign is performing at 2AM on a Saturday, they can. Do we recommend it? Well, no...but that’s beside the point! This "always-on" quality provides much-needed transparency and reassurance for the client, and can strengthen agency-client trust as a result.
The expectation for transparency, precision, and trust has only grown under the many economic pressures brands face today. And as marketing complexity increases, consumer behavior evolves, and the media landscape changes, we can count on the importance of meeting—or better yet, exceeding—those expectations to remain steadfast. Agencies with access to the right tools and partnerships will be well-equipped in that department.
The Data Canvas dashboards available in Basis drive holistic, seamless, and easy-to-understand campaign insights, giving clients a real competitive advantage in the marketplace. Curious? Connect with us to learn more!
Having a point of reference for how we are performing is valuable—both in our personal and professional lives. Benchmarks provide useful information for goal-setting by helping us to understand where we're succeeding and where we can improve. However, finding these starting points is not always easy.
Media professionals often come up against this issue when working on advertising campaigns. In planning, they need guidance on what KPI metric and value they should strive for. While the campaign is running, they can benefit from having something to compare to, ensuring that they're moving in the right direction. At the end, they need the ability to report on how a campaign performed relative to other advertisers.
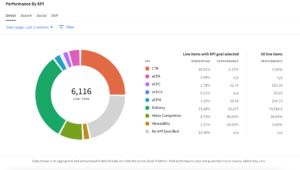
Market Trends, a benchmarking tool exclusive to Basis, was created to address this pain point. By analyzing information from 250,000+ line items and 14,000 brands, Basis gives users access to four graphs with performance and spend data across channels, verticals, properties, and KPIs.
With just a few clicks, advertising professionals can access a consistent source of reliable data, directly in the platform. Users no longer need to waste time browsing through multiple pages to get the information they want. Today, programmatic buyers can access the following graphs:
For each graph, users can customize the data by filtering by date range or by any of the 26 different verticals. See below for a sample "Performance by KPI" Market Trends graph:
Start creating more data-driven media plans and eliminate the time and cost associated with collecting, researching, and organizing information to guide your advertising choices—let Market Trends do the work for you!
Reach out to learn more about how you can utilize Market Trends to strengthen your media strategies.
Advertisers and marketers are facing an identity crisis. Major changes to Apple's iOS 14, coupled with Google's announcement about the deprecation of third-party cookies, means that we must find new ways to target audiences and measure performance.
While many groups are working towards innovative identity solutions, media planners are wondering what they can do now to adapt to these changes.
Read on to find out how you can prepare your DSP, social, and search campaigns for iOS 14 and the loss of third-party cookies.
PMP deals have proven to be a successful alternative to connect with the right audience. Many publishers offer their first-party data as PMP deals.
Contextual targeting has a variety of benefits beyond privacy compliance, such as the ability to safely target sensitive categories like healthcare, real estate, and cannabis.
Convert offline records, such us e-mail or physical addresses, into custom targetable segments for your digital media executions.
Enable machine learning to gather knowledge for your campaigns.
Apple’s iOS 14 will have a limited impact on the following (for more detail, check out LinkedIn's help center article):
The impact on Google Products will include:
Looking for more content on the future of data privacy? Check out this episode of AdTech Unfiltered featuring Facebook's head of privacy, data policy, and advertising; or this Centro Institute webinar featuring IAB Tech Lab's senior director of product management.
Whether it’s enhancing Basis’ capabilities, creating educational resources, or providing Raving Fan Service, Centro is always working to help your organization grow and succeed.
New updates. Every week.
Did you know that we update Basis every week? From an enhanced dashboard to smaller design improvements, our technology team is constantly finding creative ways to improve your experience with Basis.
They also connect you with partners to increase the options you have for building tactics. This year we:
All our 2020 features and integrations can be reviewed at BasisUpdates.net (there’s a lot!)
When the world changed, so did we.
Our award-winning training program Centro Certified went fully virtual this year. The best part? 652 participants across North America, South America and Europe have been able to join us to learn as a group. You can boost your knowledge of the media space by registering in one of our courses:
The Centro Institute also offers on-demand education. Our monthly webinars feature industry experts that give us their perspective on topics such as:
These, and many others, can be viewed anytime on our website.
Providing Raving Fan Service is in our DNA.
If you aren’t raving about our people and our products, we have not achieved the level of customer happiness for which we strive. There are over 400 Centrons dedicated to helping you maximize your experience with Basis and navigate the complexities of digital media.
Acting as your digital advocate, your CSM and Account Lead work to understand your requirements and priorities, make sure both are being met, and provide seamless communication and connection between you and Centro. Many of the enhancements and programs we create result from conversations with our clients: your needs and ideas are our priority!
We aren't done yet.
2020 isn’t over, and in the next months you can expect to see visual changes implemented to make Basis more interactive, new partners added for campaign targeting, and more stimulating conversations published for you to tune in.
Always evolving. Always innovating. For you.
Complete a purchase. Install an app. Sign up for an event.
Every campaign has a goal. And behind every campaign, there's a media buyer working diligently to ensure that goal is met.
Day after day, these superhumans evaluate campaign performance and make real-time optimizations to improve results. But when you're managing 20, 60, or 80 campaigns, it’s incredibly hard to keep track of all the changes made in a day.
Until now, optimization logs were the best solution the advertising industry could come up with to tackle this problem. These logs often show up as shared Google Sheets into which buyers input the date, time, author, platform, campaign, and other details about each optimization they make.
The flaw is that maintaining well-organized logs that include all those important details isn’t a clean process. Each time buyers log information outside the system they're working in, they must exit the task in order to add a note to their optimization log.
The process is disruptive, cumbersome, and time-consuming, which discourages buyers from tracking optimizations.
Centro created a browser extension compatible with any digital marketing platform. Basis Assistant is a one-of-a-kind tool that aims to help marketers grow their business by simplifying logging processes and facilitating knowledge sharing among teams.
Whether they're running a programmatic campaign in the open exchange, buying impressions in a social media platform, or creating a report in a dashboarding tool, users can input notes from all these sources in Basis Assistant without switching programs.
Basis Assistant provides members with access to contextually relevant information that explains why, when, where, and how a change was made. This equips members with the knowledge they need to carry out their activities without having to schedule another meeting, send an email, or coordinate a video chat to discuss a campaign’s status.
In an industry that's based on collaboration, ensuring that teammates have access to detailed information about the status of campaigns is fundamental to success. Internal communication shouldn’t involve filling 5, 7, or 12 rows in a spreadsheet so that you and your peers can know a creative was swapped, a bid was increased, or a targeting parameter was removed to boost performance.
Optimization logs aren’t just notepads. They contain a wealth of knowledge that can and should be used by teams to expedite communication, learn from each other’s ideas, and revisit the past in order to make better decisions in the future.
Built for remote work. Built for collaboration. Built for cross-channel media management.
Basis Assistant was built for you.
If there’s one thing that sets a marketer apart from the rest, it’s the ability to take complex data and present it in a visual, customized, and comprehensible way. Now, through a proprietary connector, Basis passes planning and delivery data to Looker Studio so users can create branded, tailored, and interactive dashboards.
With this tool, you can provide stakeholders with access to real-time information and easily showcase your campaign’s success. Here's how:
After logging into Looker Studio with your Google account, click here to reach Basis’ connector. Then, authorize both platforms to exchange information.
Once you’ve completed this one-time setup you can select the client and brand you'll be working with.
The dashboard will begin as a blank canvas, which you can personalize with different fonts, themes, and colors.
Looker Studio has the drag-and-drop design interface of PowerPoint, and the charting capabilities of Excel. Additional options include graphs, charts, maps, calendars, images, logos, and more.
We know that starting from zero can seem overwhelming, so we’ve put together a starter template for our users! The template includes a sample report you can leverage to tell the story of your campaigns—plus, we’ve left some notes to guide you through the process.
Now that you’ve completed your dashboard, it’s time to share your data. There are many sharing options: You can invite people to view or edit reports, schedule emails to display reports, post them on your website or social media, or download them as PDFs.
The best part? There are no additional charges to use this service. Start connecting, visualizing, and sharing your data today!
Connect with us to learn more about this and other enhancements we’ve added to Basis this spring.
The difference between ordering a small desert and a small dessert could impact your dining experience.
You partner may reject your marriage proposal if you give them a wring, instead of a ring.
In short, a misplaced word or extra character holds a lot of power!
What happens when your organization’s data contains typos? A ripple effect of errors, as many of us know all too well.
Basis includes a naming convention feature to solve for this issue. Basis users store their company’s nomenclature as formulas, and quickly apply them to line items to create harmonized records. The feature accelerates processes and prevents undesired outcomes resulting from misspelled words.
Your company’s data is one of its most valuable assets! Ensuring that it’s properly logged allows you to:
Automating processes and generating efficiencies across your campaigns, team, and business is at the core of what we do. Learn more about how Basis can help your business! Connect with us today.
Campaigns starting. Campaigns ending. Campaigns pacing behind. Campaigns pacing ahead. Proposals awaiting a response. Messages here, messages there. The day goes on and the task list quickly grows!
Centro recognizes that digital media buying is fast-faced, so we've optimized our dashboard. Upon logging in to Basis, users will now receive a customized experience—an advanced dashboard with a message center, along with a collection of widgets and graphs. These new features will help you to:
Not yet on Basis? Connect with us for a demo of this and many other workflow automation tools for your digital media business.
Three months ago, a client asked for your help promoting their latest solution.
You began strategizing the perfect media plan and over the course of several weeks, you placed pixels, uploaded creatives, monitored your campaign regularly, turned off poor-performing inventory, and shifted budget towards channels that were generating the best outcomes.
At the end of the cycle, you succeeded—your hard work paid off and it’s time to share the results with your client!
And what do you get? A cluttered Excel sheet that requires another handful of hours of editing before you can share it with your audience.
Not anymore.
Grow your business with polished, client-facing presentations that visually illustrate your campaign’s performance. Through our new one-of-a-kind reporting option, Basis eliminates the time and cost associated with collecting, summarizing, and organizing data.
Navigate to the reporting menu and choose "Campaign Performance Presentation" to export a PowerPoint file that narrates your campaign’s triumph in a clear and visual way.
What’s included?
Each presentation contains a series of slides with charts and graphs for your Direct, DSP, Search, and Social executions. You can choose to include information on video completion, viewability, or conversion metrics as well as reporting by day of the week, weeks, and months.
Additionally, the presentations have been developed in a way that they can be easily formatted. Using the "Slide Master" function in PowerPoint, you can apply your organization’s branding—logo, fonts, and colors—to make the presentation your own!
Interested in a full walk-through of our campaign performance presentations? Contact us to set up a demo!