Dashboards

Automated 
Reporting Capabilities

Approachable data is here.

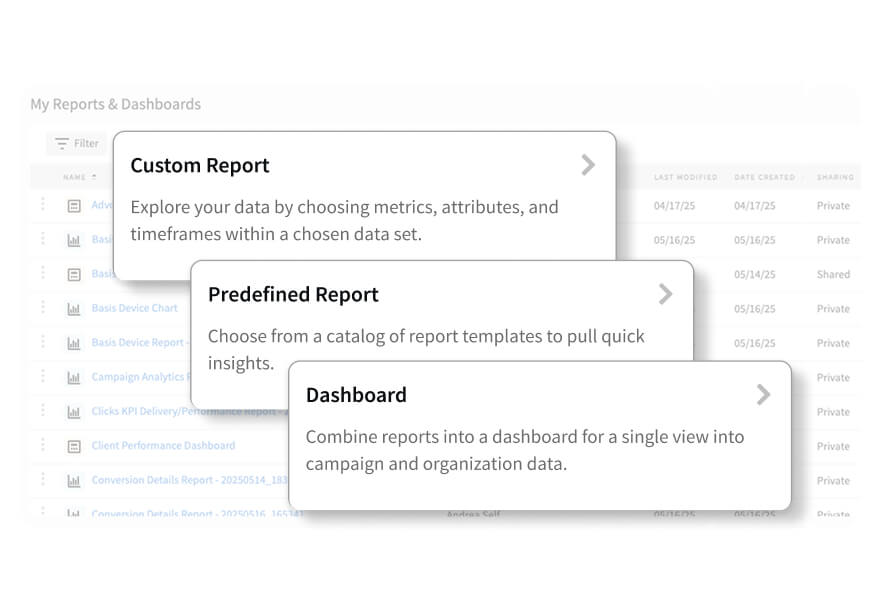
Say goodbye to spreadsheets and static presentations. Communicate with stakeholders through customizable, live dashboards. Basis depicts planning and delivery data to tell stories and inform business decisions

Benefits

Dashboard Highlights

Data-Driven Decisions

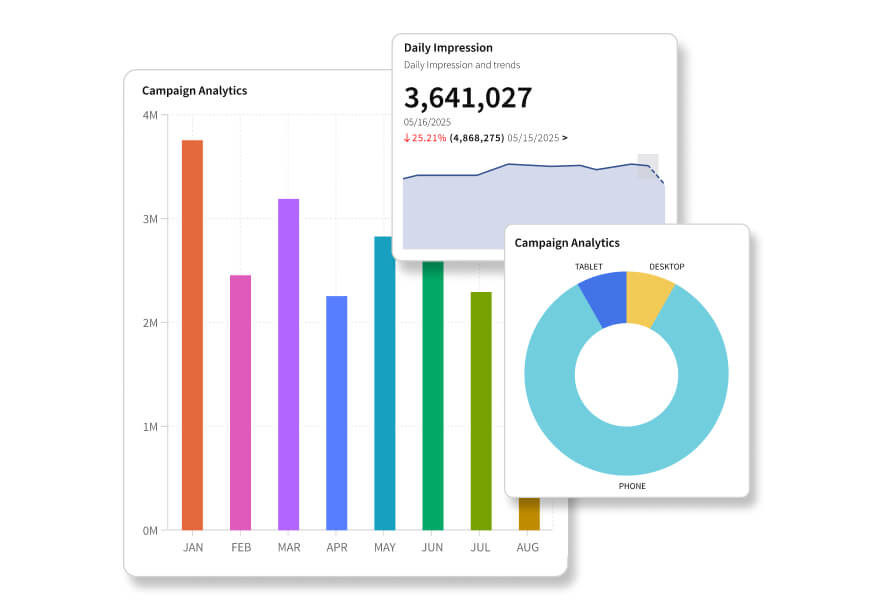
Drive better optimization decisions down the road with accurate and real-time data reporting capabilities for campaigns. Utilize the granular dashboard in Basis to optimize quickly.
data from Basis dashboard
chart from Basis dashboard

Organizational Efficiency

Spend fewer hours on data analysis and reporting. Gain a holistic view of a wide range of data to better monitor team operations and workload.

Competitive Advantage

Leverage data insights to better anticipate performance issues, monitor seasonal changes and optimize more quickly.
pie charts from Basis dashboard
organizational Venn diagram

Business Continuity

Switching managed service providers? Take your Basis instance with you—including all its connectivity, historical data, and communications.

DAta Integration

Visualize and analyze your data anywhere
Basis Data Sharing makes it easy to integrate your data with third-party dashboards, including Tapclicks and NinjaCat.
tapClicks logoninjacat logo

Features & Capabilities

icon of 3 screens and an arrow

Media Performance

Utilize Basis’ programmatic, search, social, direct, and CTV APIs to eliminate manual reporting merges from disparate data sources.

icon of three increasing vertical lines

Business Intelligence

Gain access to accurate, consolidated analytics and report on media investment ROI, workload, vendor spend, performance data, and more.

icon of lightbulb

Team Insights

Use workload metrics and campaign counts to better support media teams, conduct workforce planning, and drive greater productivity.

FEATURE SPOTLIGHT: DATA CANVAS

A dashboard is worth a thousand data points. Let Basis help you tell your story.

Visual Data Storytelling
Consolidated Tool Stack
Narrate the trajectory of your campaign with visual assets
Determine what metrics you need to showcase
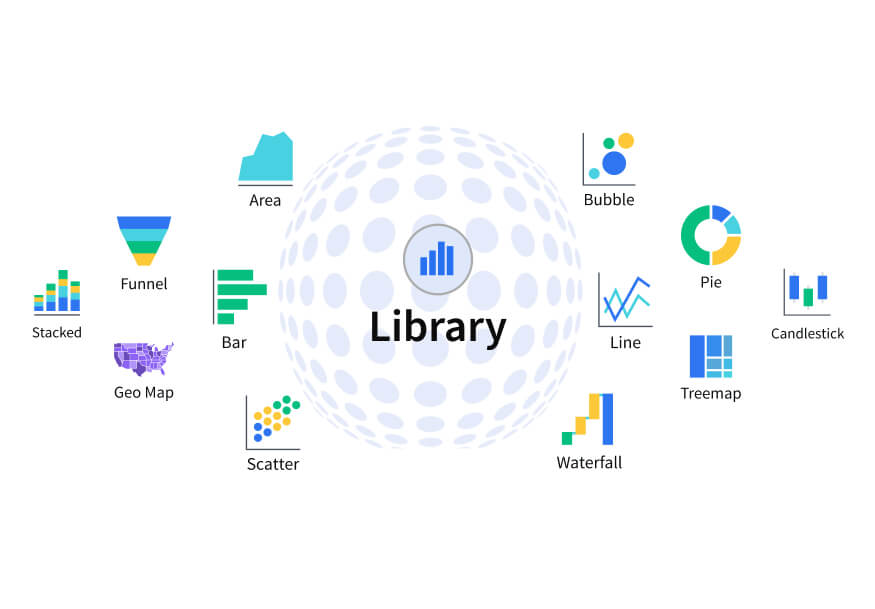
Select a style that illustrates their performance
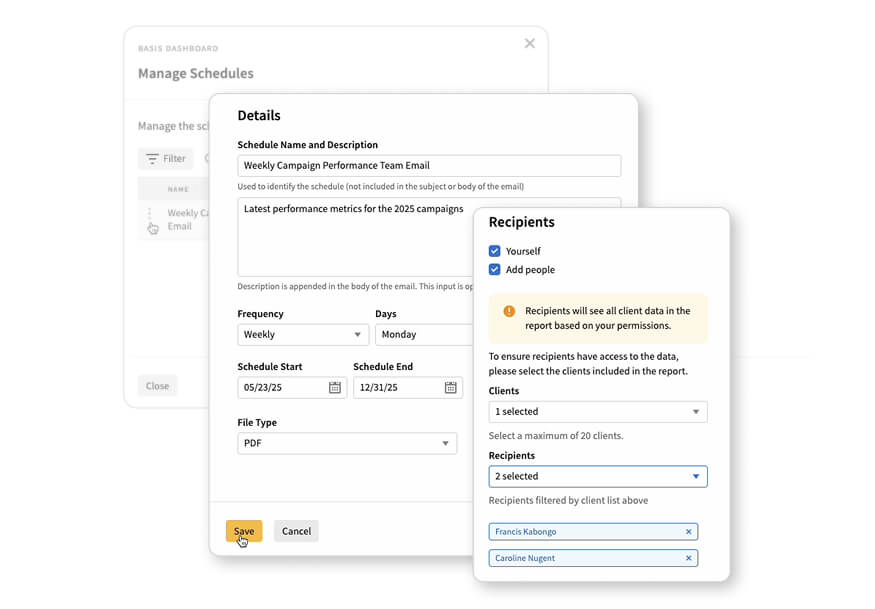
Deliver the message manually or automatically
Data Canvas reduces operational costs resulting from:
Installing, onboarding, training, maintaining, and supporting new tools
Manual errors in transferring data between programs
Processing and managing multiple vendors and partners
  • Client Headshot
    Using Basis, the transparency of reporting and increased campaign metrics has emboldened our clients to shift more dollars towards digital tactics, namely paid search and programmatic video and display.”
    — Renée Harriman  |  VP, Media  |  VI Marketing and Branding
    quotation marks
  • Client Headshot
    We work smarter and faster with Basis. The platform’s automation and transparency allow us to quickly discover optimizations and opportunities. This means great performance, happy clients, and growth all around.”
    — Elise Kogelnik  |  Mgr, Paid Media + Display  |  Fathom
    quotation marks

Related Content

Jun 9 2022 Blog
Improve Client Relationships with Automated Report Dashboards 

Automated reporting and visual dashboards can be game changers for marketers—particularly when it comes to client communications. 

Read More
How Custom Dashboards Can Improve Your KPIs and ROI

We explore how custom dashboards can help improve KPIs and ROI while enhancing collaboration—both internally and externally.

Read More
Paralysis by Manual Analysis: A Silent Killer of Marketing

Manual reporting a major pain point for marketers. Here's what lies ahead for media planners looking for more efficient reporting solutions.

Read More

A New Era In Advertising

Transform your business today.
Connect With Us