In the modern world of digital advertising, marketing analysts must adopt a scientific and almost artistic approach to exploring and dissecting campaign performance. With businesses today compelled to invest in more channels than ever before - paid search, social, email, PR, SEO - it has become increasingly difficult for those working daily with data to expose truly valuable insights and precisely measure the effectiveness of their strategies.
Marketing dashboards offer a simple solution to this problem, pulling data together from disparate sources and providing dynamic visualizations of performance - from a high-level down to channel-specifics - all in one single location. The ROI gained from dashboards is greatest when you set-up defined components that empower you with all the information you need to move the needle for your business. Ultimately, the more refined and insightful your custom dashboard analytics are, the more actionable intelligence your evaluations will yield.
In this blog post we delve into four dashboard components that every digital analyst should utilize in order to facilitate more penetrating examinations into performance. Each of the four examples we highlight is designed to help analysts report performance findings easily to all stakeholders and serve as a compass for charting a path forward on the marketing roadmap.
Component #1: Most Recent Performance Snapshot
Overview:
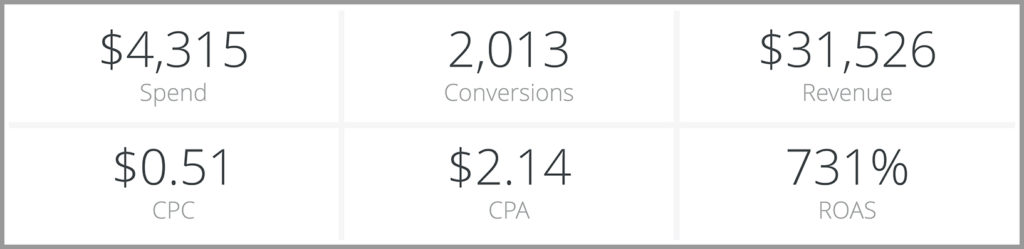
Format: Single Value Tiles
Time Period: Yesterday
Metrics: Ad Spend, Cost per Click (CPC), Conversions, Cost per Conversion (CPA), Revenue, Return on Ad Spend (ROAS)
Arguably the most important component you should have on your dashboard is a snapshot of campaign performance from the previous 24 hours. When it comes to digital advertising, the competitive landscape is forever shifting and it is therefore imperative to have a succinct birds-eye view of the return on investment your campaigns are bringing in. This simple summary does the job, empowering you with a quick understanding of aggregated investment, volume, unit economics, and campaign efficiency, and, essentially, whether your campaigns are performing as projected or if any unforeseen issues have arisen. Having this uncomplicated at-a-glance visual aid at the top of your dashboard will help you swiftly identify any performance changes as they happen.
Common Variations: Duplicate and segment widgets with added filters by publisher, channel, campaign, product/service, etc.
Component #2: Most Recent Performance Snapshot by Segment
Overview:
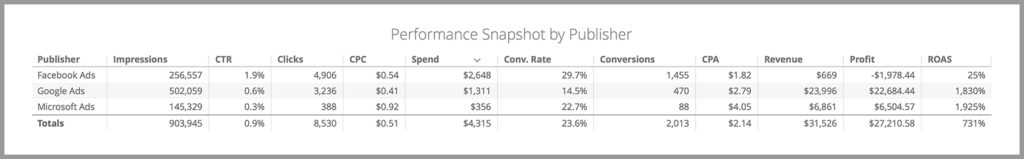
Format: Table
Time Period: Yesterday
Metrics: Impressions, Clicks, Cost, Revenue, Conversions, Profit, Return on Ad Spend (ROAS), Cost per Conversion (CPA), Conversion Rate (CR), Click-through-Rate (CTR), Cost per Click (CPC)
As all analysts will affirm, campaign performance varies widely by segment, whether it be channel, publisher, or any other dimension. Focusing on the example of publisher segmentation, this dashboard offers clear insights into how each of your publishers performed the day prior and which, if any, has been the driving force behind any unexpected changes in performance, positive or otherwise. Search engine marketers using Bing as an additional advertising channel will find this snapshot particularly beneficial. While reach and impressions on Bing tend to be lower compared to Google Ads, it could be more valuable in terms of cost and ROAS. The only way to test this hypothesis is by paying close attention to how these key metrics differ per publisher.
Component #3: Recent Performance Trending
Overview:
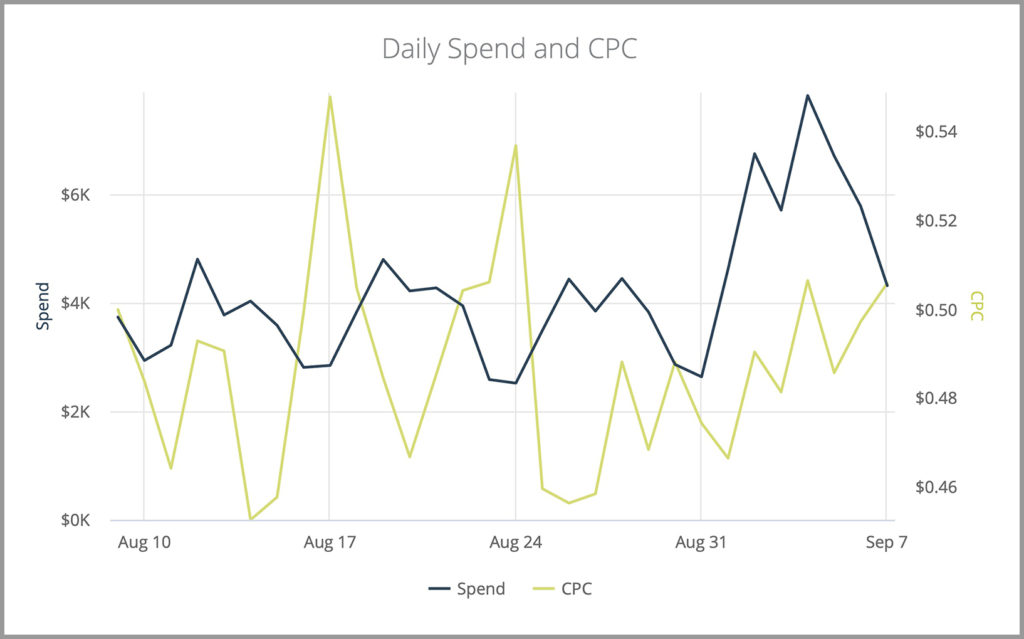
Format: Line Charts
Time: Last 30 Days
Metrics: Ad Spend, Cost per Click (CPC), Conversions, Revenue
While your most recent performance snapshot offers a flying summary of campaign execution, there are also other important trends you’ll want to stay abreast of in order to maintain perspective and provide more informed insights to your C-level executives. You can do this by creating a component that includes line charts that detail swings and movements in key metric performance over the past 30 days.
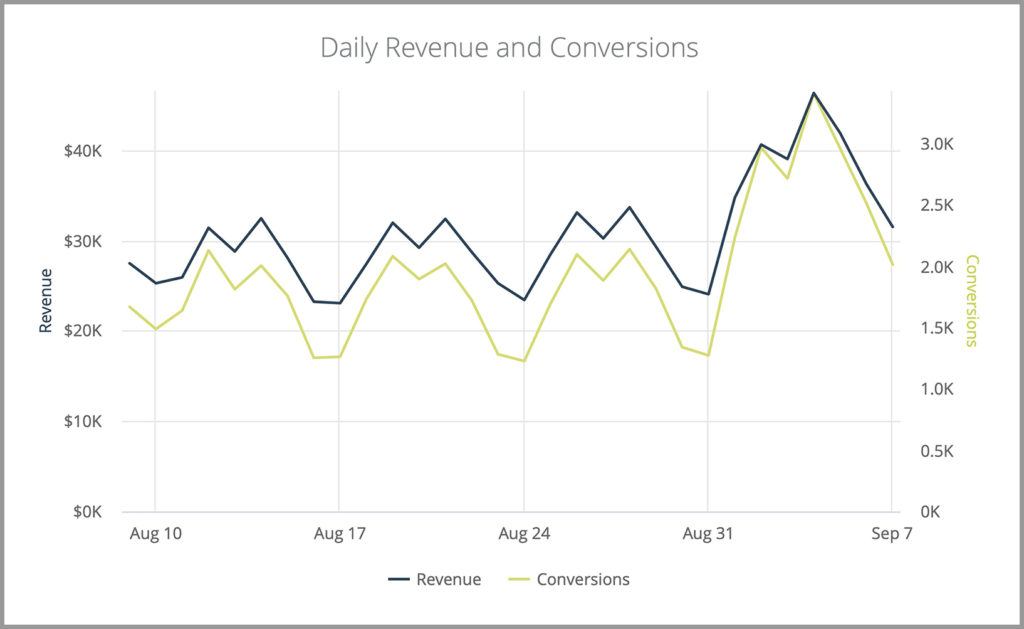
Monitoring trends over an extended period such as this allows you to understand the daily fluctuations within advertising investment and revenue generation. Line charts illustrating 30-day changes make it possible to expose performance tendencies as they begin to reveal themselves. Quickly discovering negative shifts in conversions and revenue affords marketers the opportunity to diagnose and fix issues before they develop and hamper campaigns in a significant way.
Common Variations: Duplicate widgets and create additional graphs with other relevant metrics. You can also filter by publisher, channel, campaign, product/service, etc.
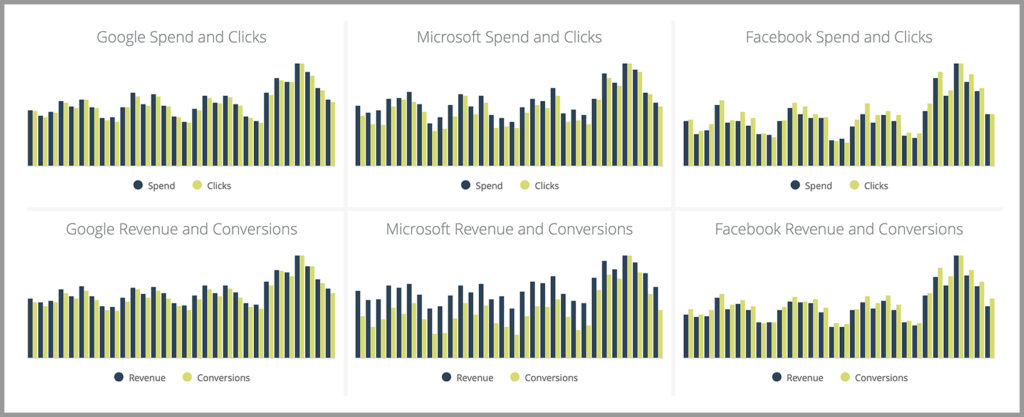
Component #4: Recent Performance Trending by Segment
Overview:
Format: Bar Charts
Time: Last 30 Days
Metrics: Ad Spend, Clicks, Conversions, Revenue
Continuing with the model of segmenting by publishers, this dashboard component is essential for monitoring trends over a one-month period. A whole host of factors can impact advertising performance by segment almost overnight and thus collating all this data together allows you to quickly recognize the daily fluctuations in advertising investment and revenue generation for Google, Bing, Facebook, and other publishers. This can help you understand how search advertising performs compared to social, which publishers bring in the most conversions and revenue overall, and how consistent your advertising campaigns tend to perform across the 30 days. If the performance for one publisher starts trending differently, you can swiftly determine the root cause and make optimization changes.
Common Variations: Duplicate and segment by channel, campaign, product/service, etc.
Wrapping Up
Every business has unique goals and key metrics that drive marketing performance. By leveraging expertly designed dashboards, whether from a library of templates built with components like the ones discussed in this article or by building your own, digital marketing analysts can become empowered to maximize the performance insights they need. Dashboards offer a quick overview of daily advertising performance, help you follow recent trends, or break down performance by publisher and other segments to unlock opportunities for improvement.