
Technology
Basis Platform
Advertising Operating System
Communication Portal
Intelligent Collaboration
All Channel Activation
Activate Media on Every Channel
Consulting
Resources
When it comes to online advertising campaigns today, there are countless metrics that could be monitored, and if you’re a marketing manager drowning in a sea of Google Analytics jargon and social media buzzwords, then you’re certainly not alone. As both the number and consumer adoption of digital channels continues to grow apace, so, too, does the number of tools a marketing organization needs to accurately map the routes and experiences that drive revenue. We’ve jumped from only 150 tools as of 2011 to over 8,000 in 2020 according to Scott Brinker’s now renowned MarTech supergraphic, equating to an extraordinary growth of 5,233%.
The fastest-growing category in this technological explosion is Data. This makes perfect sense, of course, as more channels ultimately mean more data. With the global datasphere predicted to grow to 175 zettabytes by 2025, increasing percentages of that are becoming accessible to marketers who own the right tools and mechanisms to manage and parse it. The fundamental organic signals of page views, unique visitors, session duration, email open rate, and more are joined by paid signals including impressions, click-through rate, conversion rate, and revenue per click. All of this has recently been augmented by location data from mobile and wearable devices. Then you have preference data from social media and enriched personal data that comes from first-party sources such as account and purchase history.
Everything considered, modern marketing is all about metrics and numbers. But which numbers provide the real value? We’ve reached a point in marketing where the focus is shifting from data collection to data consolidation. For marketing managers, it’s time to double down on the ability to bring together the right data - the kind that provides actionable intelligence to fuel next-level growth.
That is why dashboards are critical today. With meticulous curation, marketing decision-makers can utilize them to remove any irrelevant data from their line of sight and really hone in on the key parameters at stake in a campaign that can be evaluated conjointly for better forecasting. This guide looks to help marketing managers understand the increasing importance of using best-in-class dashboard frameworks with examples of data sets that can expose real areas of opportunity.
Yearly big picture trends interest executives and daily performance fluctuations concern analysts. Midway between, looking at campaign numbers at a monthly level ultimately delivers more insights than anything else and therefore represents the perfect timeframe for middle management. Weekly reporting is certainly important as well, but the channel bringing in the most traffic is not necessarily the one capturing the best quality leads in the end - that you cannot understand until a number of weeks have passed.
Monthly overviews present a broader feeling of how campaigns are fairing and with a rolling review, marketing managers are afforded access to data that can empower them to adapt future forecasts to reflect the very latest industry, economic, and business changes. This, subsequently, enables decision-makers to reduce risk and allocate resources more optimally in pursuit of financial objectives.
Overview:
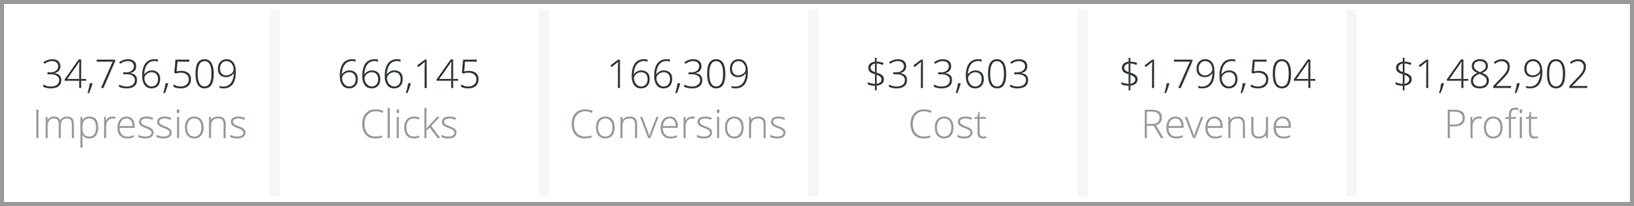
Format: Single Value Tiles
Time Period: Trailing 30-days
Metrics: Impressions, Clicks, Conversions, Cost, Revenue, Profit
The most valuable dashboard component a marketing manager can have is a snapshot of the metrics most important to their business. This simple table brings together all the pertinent digital marketing performance metrics from the past 30 days and enables the user to quickly see and understand aggregated advertising investment, volume, unit economics, and campaign efficiency. The layout here is also designed specifically in this way to help the eye move from left to right seamlessly: Impressions lead to clicks which lead to conversions. Cost leads to revenue which results in profit.
Overview:
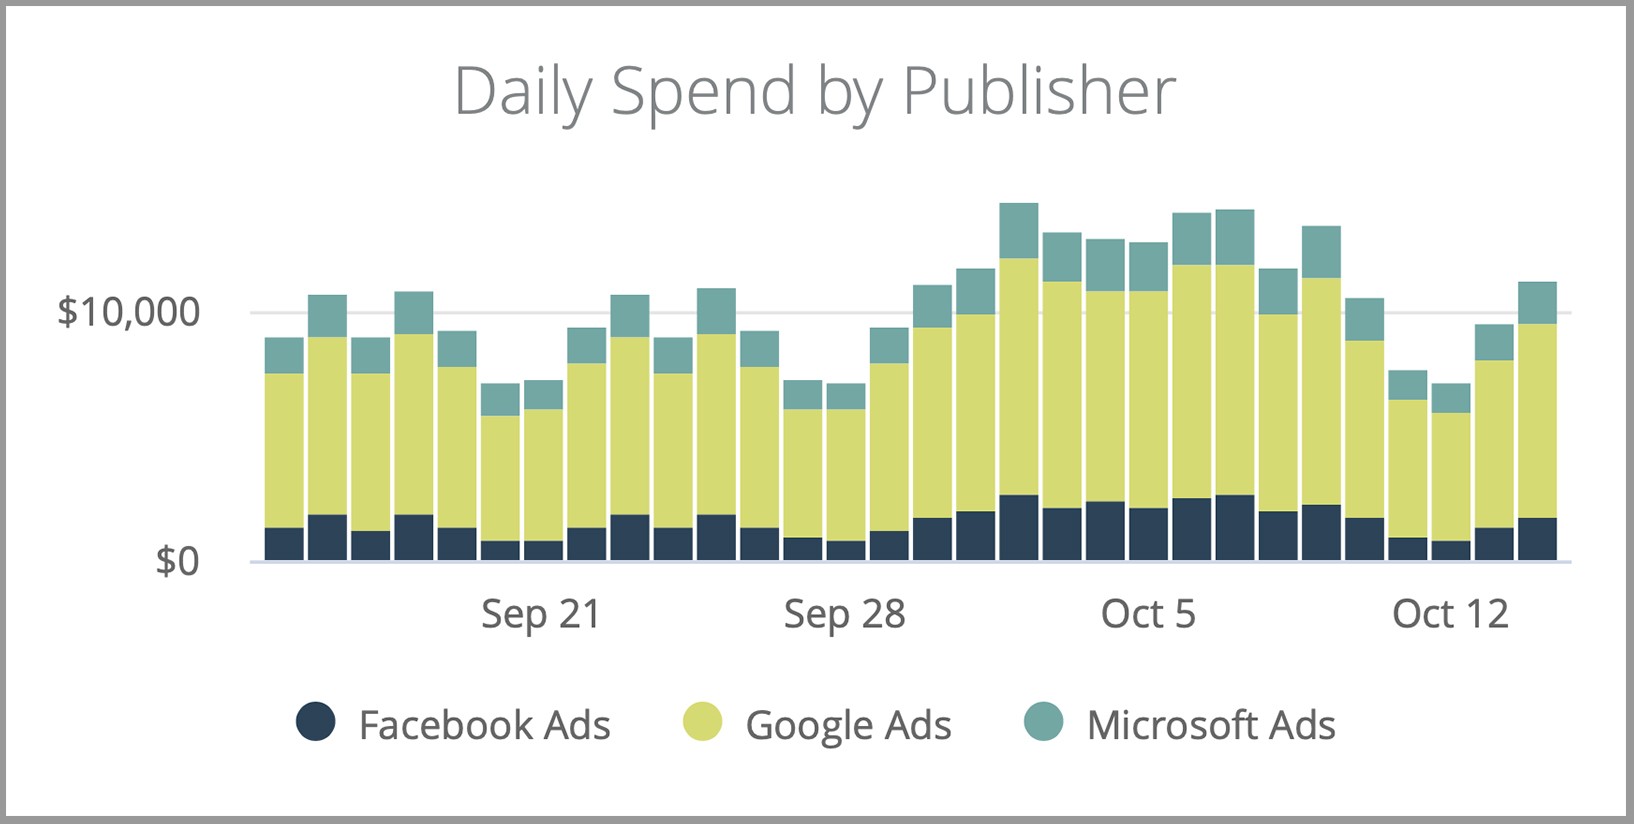
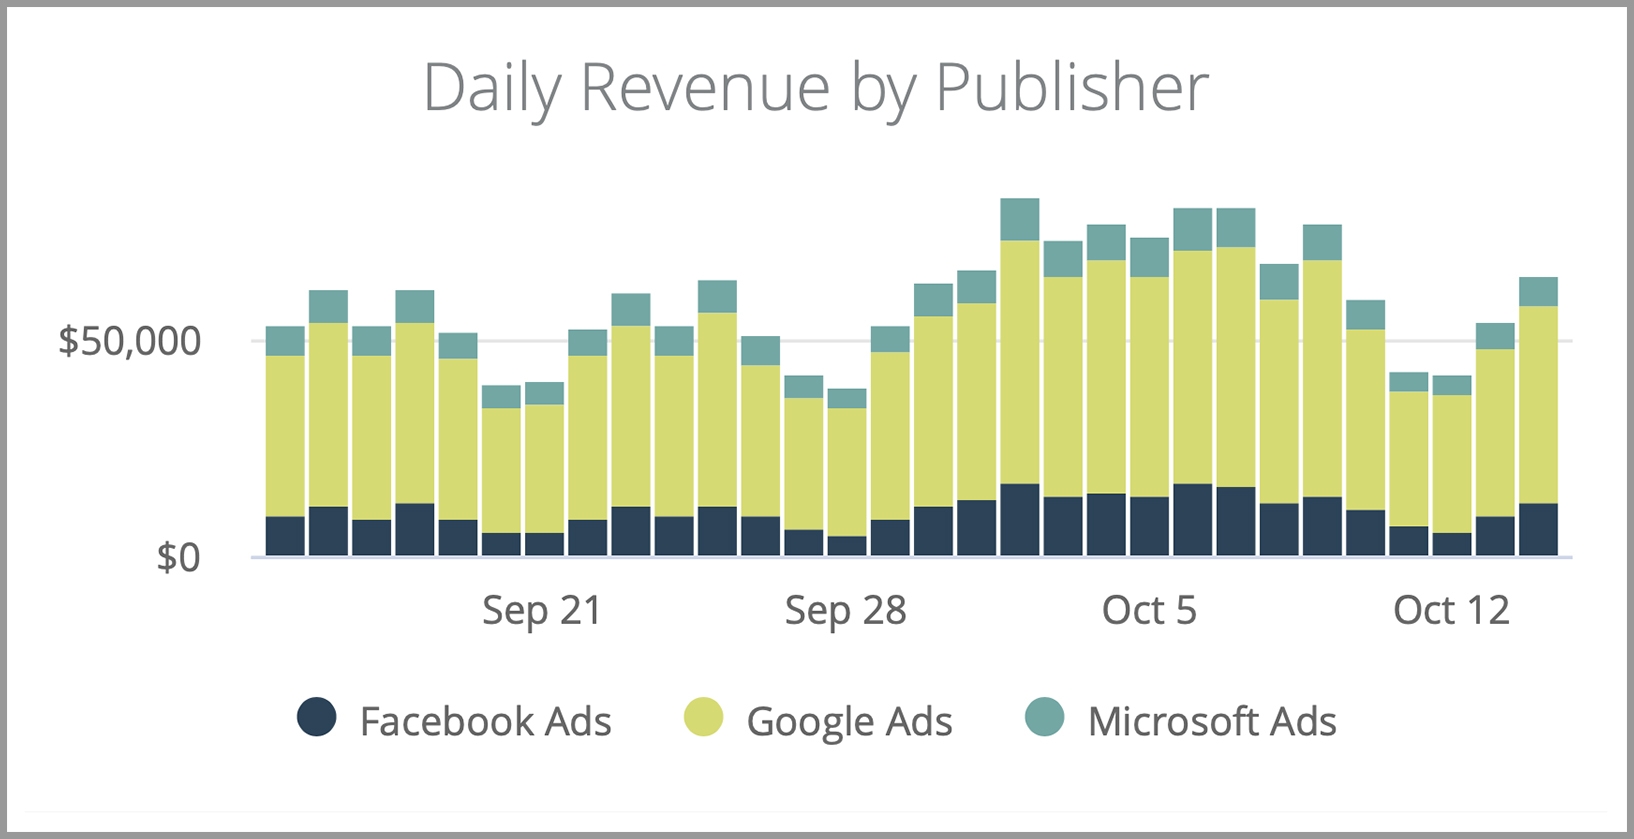
Format: Horizontal Bar Charts by Area
Time Period: Trailing 30-days
Metrics: Daily Spend and Daily Revenue by Publisher
For marketing managers interested in monitoring performance trends for different marketing segments, then this component is a must. Here’s a sample set of dashboard widgets showing top-level metrics trending segmented by publisher. With marketing campaigns becoming increasingly complex, these stacked bar charts offer a birds-eye view of how strategies have been playing out over the last 30 days and how an investment portfolio is breaking down. If any one of Facebook Ads, Google Ads, or Microsoft Ads start to trend against expectations, or if certain investment criteria are not being met, these visualizations will expose that and afford marketing teams the opportunity to rectify the problems before they evolve.
Overview:
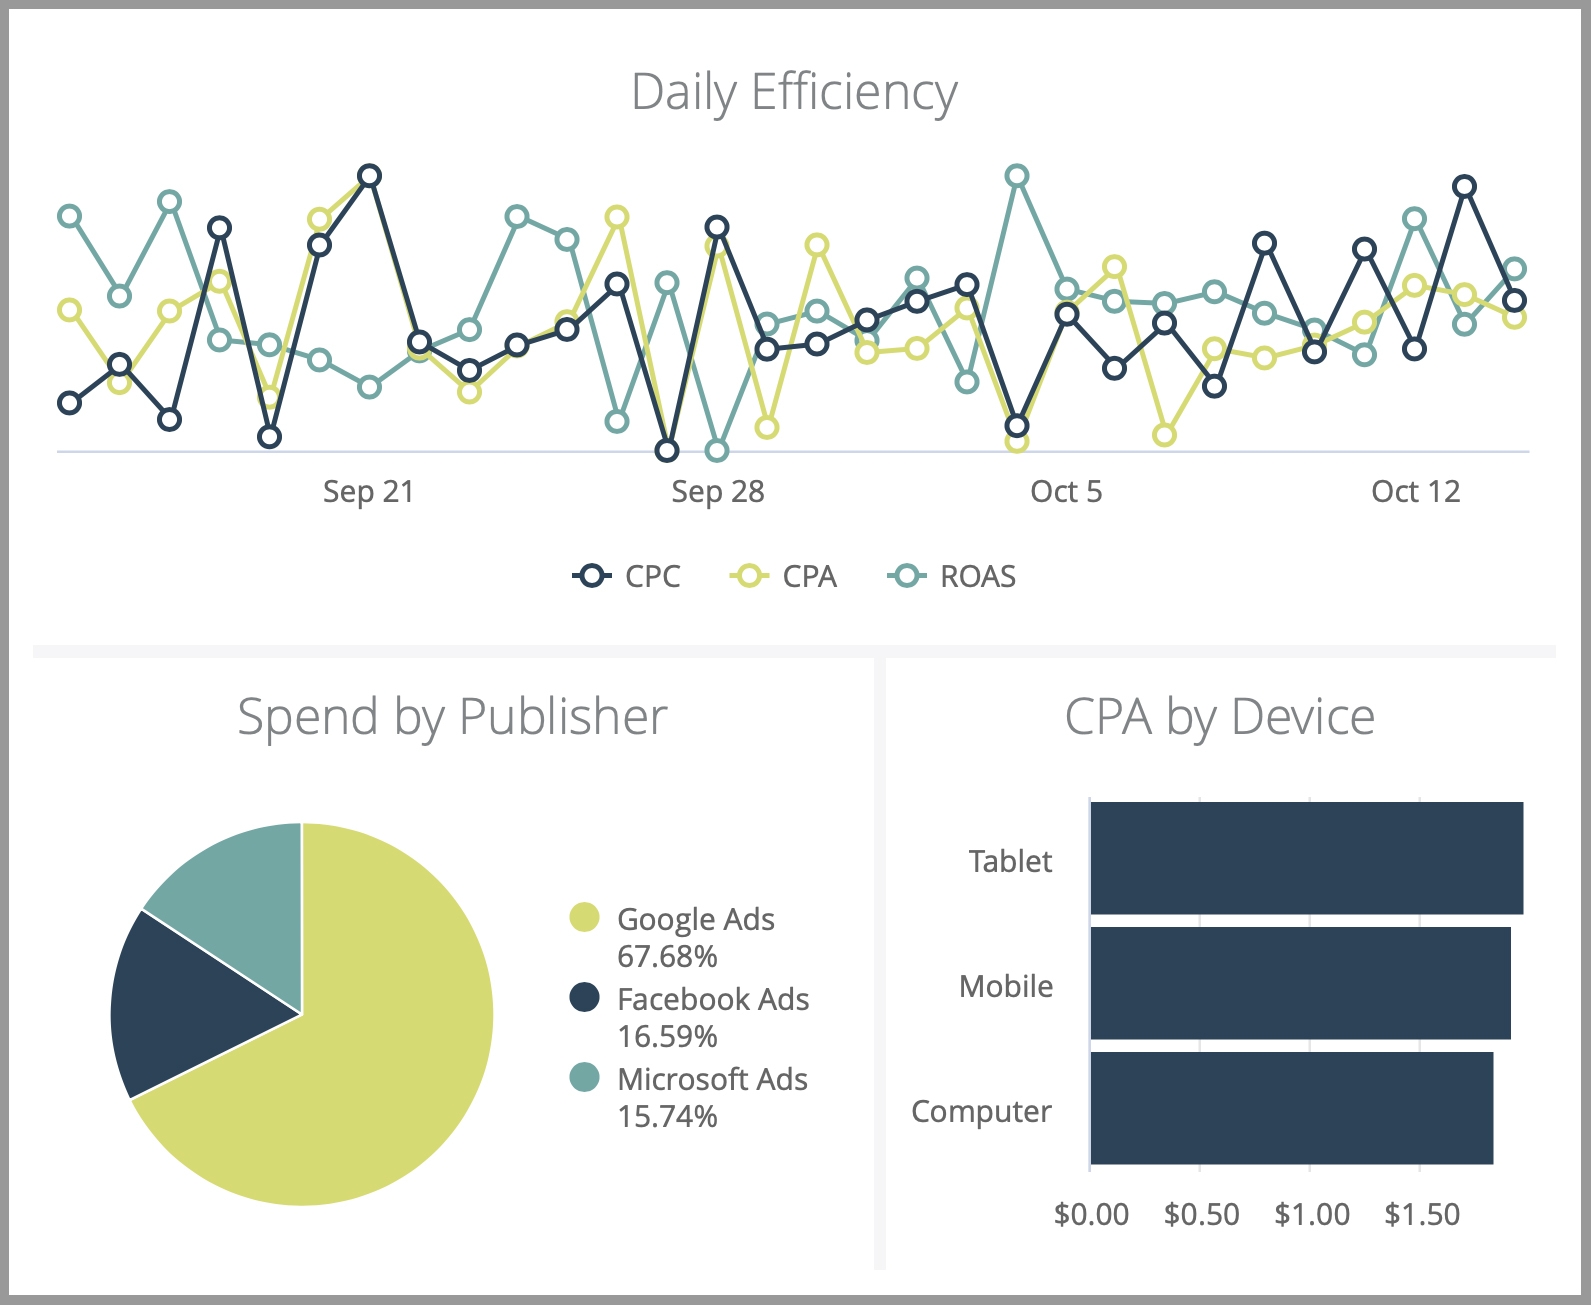
Format: Line Graph, Pie Chart, Horizontal Bar Charts
Time Period: Trailing 30-days
Metrics: Daily Efficiency, Spend by Publisher, CPA by Device
While your most recent performance snapshot gives you a fast summary of performance, there are also some important efficiency metrics you’ll want to pay close attention to. You can do this by creating a component that includes line charts detailing trends in key metric performance over the past 30 days.
Every business has unique goals and key metrics that drive marketing performance. Custom dashboards offer a flexible solution digital marketing managers can utilize to maximize the performance insights they need.
You can get access to these dashboard templates and a dynamic framework to build your own from every marketing data source you have using the reporting and analytics tool available within Centro’s intelligent automation platform, Basis. Our easy-to-set up, easy-to-use technology helps marketing organizations unlock the power of their data and extract deep insights into the behaviors, and needs, of their target audiences.