Optimizing campaigns is considerably more than just setting the right bid on your keywords. It’s about making sure that you have the right ads, the right campaign and ad group structure, and landing pages that convert well and match up nicely to your ads and keywords. Core to all of this is the process of verifying and corroborating you have all the right keywords in the first place. That’s where a lot of time is spent when it comes to optimizing campaigns and extracting the most out of your marketing dollars. Here, we explore three ways you can find the terms that are not working for you and explain how you can utilize smart reporting to make the task infinitely easier.
Dashboard Component #1: High CPA Keywords
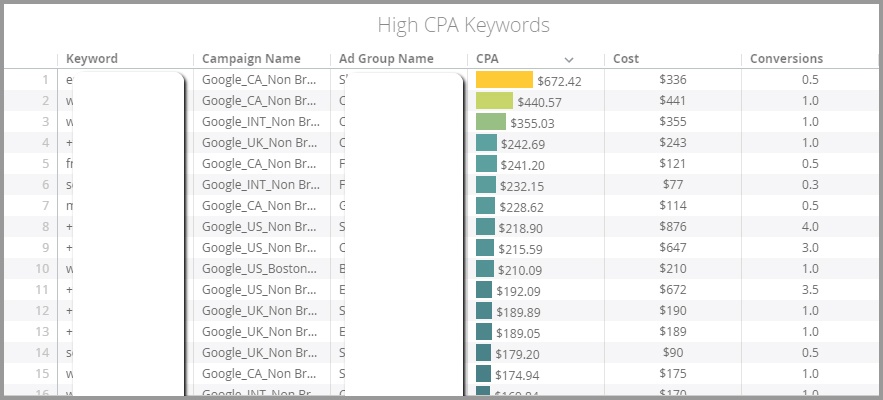
Let’s first talk about high CPA keywords. These are terms that are driving traffic and conversions, but at too high a cost according to your goals. Identifying these terms, and then acting on them, is the purpose of this dynamic dashboard component. The chart itself is a simple one, whereby you generate a keyword report and filter for any active keyword that is above a certain CPA, ROAS, or similar goal. This assumes that you already have a CPA/ROAS target in mind, of course.
It’s best to start at the top, and either lower bids or pause the terms that are doing the most damage. You can download the data and then immediately upload it into Adwords Editor for a quick fix. The filters in this chart are for active keywords, above a CPA target. Note that cost and conversions are included as they help to provide more context around the keywords. For example, partial conversion (such as the 0.33 above) may make the CPA look inflated, or perhaps the keywords you’re reviewing are just low volume. Campaign name and Ad Group name are also visible to make it easier to upload into Adwords Editor, but also to offer extra perspective.
Additional Considerations
Look at search terms, in addition to the keywords, to ensure CPA isn’t being affected by irrelevant searches.
Consider looking at Quality score and related metrics. Is it a relevant term and is there another reason why performance is down? Perhaps the ads are poorly written, or the landing page isn’t a good match.
Dashboard Component #2: Zero Conversion, High Spend Keywords
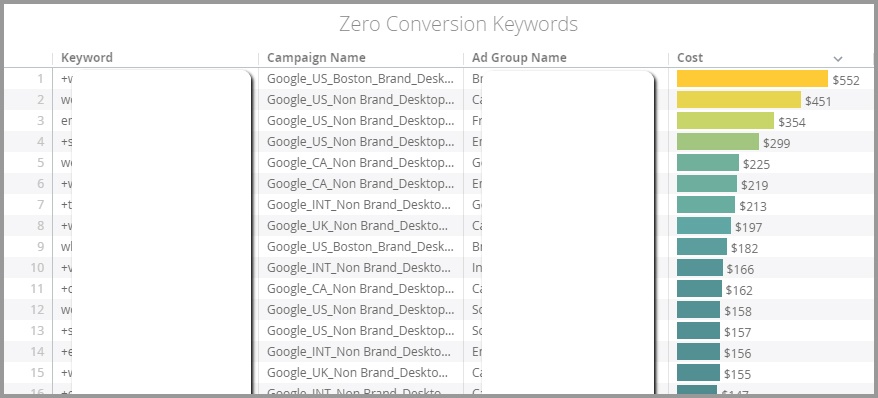
These are the terms that are getting traffic but not converting at all. They are usually a low hanging fruit for optimization, but automating the reports helps to make this task more regular, and catch terms more quickly. This chart filters active keywords for zero conversions, sorting the cost highest to lowest. Generally, these are great terms to plainly pause out as they can immediately save quite a bit of money.
Additional Considerations
Are you certain that there’s not a reason that the keyword isn’t converting? Is it going to the wrong landing page? Is there a tracking issue?
Be sure to look at a meaningful date range as well. This will eliminate any concern that you’re not seeing a false negative or reacting to what may be a statistical slump.
Dashboard Component #3: Low Spend, Zero Conversion Keywords
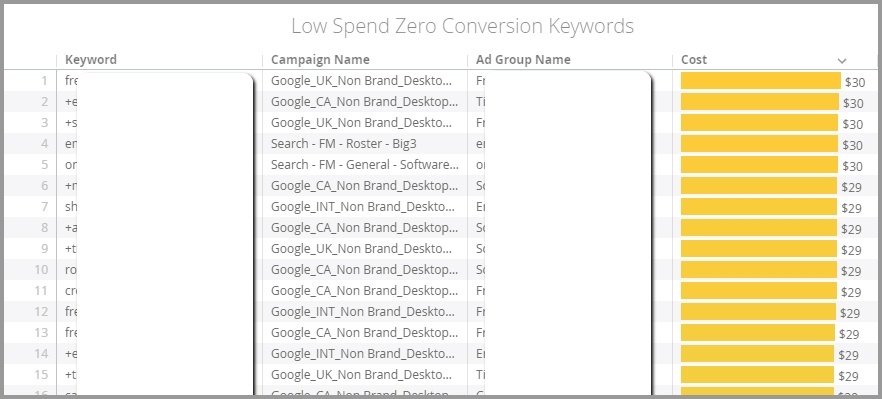
It’s a general, albeit old, rule that you let a keyword garner a certain threshold of spend or clicks before deciding if a term is working or not (I’ve generally seen this number at as little as 100 clicks). However, there are a lot of search terms that are rarely searched on, and may take a long time to collect enough data or statistical significance. These can still cost you money, but slowly bleed your campaign of funds over time, negatively impacting your performance.
This chart looks at keywords that have no conversions, but also low spend. In this case, we’re filtering for active keywords with zero conversions, but also less than about $30 of total spend. There can sometimes be thousands of terms that fit in this category, and this report makes finding these terms effortless. Plus, the simple act of downloading the data and then uploading it into Adwords Editor makes fixing this incredibly easy.
Additional Considerations
Don’t be too concerned about whether a term is really relevant or not. If it’s not working, it’s better to cut it out and focus on the higher volume terms.
Ensure there is not a reason why the terms aren’t serving fully. Is there another keyword competing with it? Or, is there a negative keyword conflict that should be removed?
Other uses
In addition to looking at just keywords, it’s also recommended to review search terms. It’s easy to recreate or duplicate your charts to look at search terms instead of keywords. Doing this could provide some more terms that are irrelevant or poor performers to add as negatives. It’s also possible to set up your filters to focus on particular campaign sets. For example, looking at Non-Brand versus Brand, or International versus Domestic campaigns.
By tweaking the filters on search terms, you could further create charts that find search terms that could be added to campaigns. And all of this is automatic, without the need to download those pesky CSV files.
The possibilities really are endless here, but carefully set up reports are going to be more essential as marketing continues to become more complex.
~
If you’re looking to replicate any of the analytical tools you see here, our universal reporting technology can take your data and recreate these views in a matter of minutes. As with any report, though, be wary of blindly following the data. With each of these charts, and intended uses, there are also some cautions, or additional considerations to keep in mind.