
Technology
Basis Platform
Advertising Operating System
Communication Portal
Intelligent Collaboration
All Channel Activation
Activate Media on Every Channel
Consulting
Resources
In Part 1 of this series, we harped on the importance of measuring value by a metric that accurately represents it. “Each and every keyword is unique,” we concluded, “they will all defy the average. The goal of any measurement is to understand those differences, using all the signals available and discarding all the noise.”
And the goal of any optimization is to react to those differences. Part 1 demonstrates how the way we optimize is inextricably linked to the way we measure - we can only optimize as well as we measure, and no better.
For a summary example, say we have a set of 100 keywords and our task is to rank them in order of value. But we have two metrics, both of which purport to at least partially denote value. If we rank the keywords by one metric we’ll have a very different list than if we rank by the other. Maybe we wise up and put the two metrics together, but that only results in a third and different list entirely. How do we know which one to use to inform our budgetary direction?
There is no greater service you can do to your SEM optimization than understanding your business. In fact, this is the only way to answer non-arbitrarily the question of “which list has the right rankings?” It matters very little whether you calculate thrust, fuel requirements, and trajectory if you don’t know which planet you’re aiming for. The scientific approach is pointless if you don’t first know your goals.
To start, here are some questions to think about before voyaging for the perfect metric…
1. Does my website have one funnel or multiple? How many unique flows are there?
2. What are all my tracked conversions within these funnels? How do they relate to one another? Which are in parallel and which are in series?
3. What are the relative “Conversion Rates” (conversions / clicks) and “Monetization Rates” (instances of monetization / conversions) for each conversion point?
4. What are the relative frequencies (i.e. Volume) of each conversion?
5. Are any two conversion points mutually exclusive? Redundant?
6. What are your goals for your SEM program? What are you trying to maximize? What are your constraints?
These questions are just to get you thinking - you don’t need to know exactly the conversion rate of every point along your funnel. But it is helpful to have an idea of how that knowledge might change the way that you prioritize your optimization inputs.
By now, you have a pretty good understanding of your conversion funnel. You know the various points along it and how they relate to each other. You recognize that they all tell limited parts of a grander story: the truth but not the whole truth. Now, how do we turn these insights into something useful?
The perfect Hybrid Conversion balances two criteria:
1. Frequency
2. Accuracy
To illustrate these, let’s return to our simplified example from Part 1. Suppose your conversion funnel is comprised of ‘Contact Form Fills’, ‘Loan Applications’, and ‘Program Enrolls’, in that order.
Click --> Contact Form Fill --> Loan Applications --> Program Enrolls
Let’s then take a snapshot of 1000 clicks and look at the sample data that results.
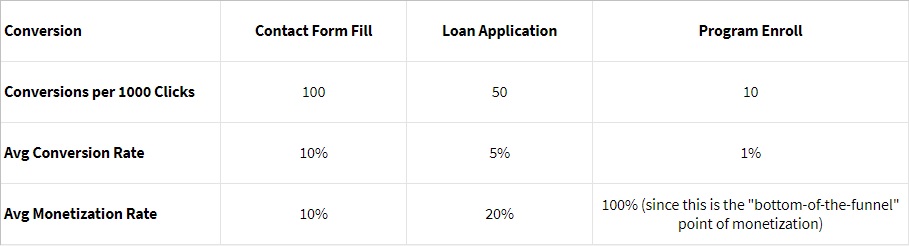
In terms of our criteria, “Conversion Rate” is a measure of Frequency whereas “Monetization Rate” is a measure of Accuracy. Notice that they’re inversely proportional (but we’re used to such tradeoffs in SEM, where the only maxim seems to be “what goes up… must cause something else to inconveniently go down”.) The better the lead of any leading indicator (like an upper-funnel proxy conversion), the worse the indication. For this reason, the operative word is “balance”.
Armed with this knowledge, we can now concoct the perfect Hybrid Conversion. But first! A detour into the importance of Frequency.
The long-tail is a much talked about topic in SEM. But how long exactly is it? Where does it end and the body begin? And where does the body meet the head terms?
Well, where you draw the line depends entirely on which metric you’re looking at. In the upper funnel, there's more volume so fewer keywords are long-tail. In the lower-funnel, the inverse is true. Generally, the deeper down into the funnel you go, the longer the tail gets.
When it comes to optimization, the long-tail is notoriously difficult for all but the smartest data sharing techniques. But what we’ve shown above is that you can finagle your metrics to squeeze or shrink the tail to your advantage. This is the very reason we use upper-funnel proxy metrics in the first place: they give us information where we might not otherwise have any. And where there’s more data, there’s more potential for action.
“Statistical Significance” is the point at which we have enough information to act. What is that point for your program? There’s no surefire answer, but the below formula offers a simple rule-of-thumb. Plug in the Conversion Rate for a high-level segment and out pops the click threshold at which the conversion data of particular objects within that segment is actually meaningful.
Statistically Significant Click Volume = ln (0.005) / ln (1 – Conversion Rate)
Let’s try it out! We’ll calculate click thresholds for the conversion points on either end of our example funnel.
Contact Form Fill | ln (0.005) / ln (1 – .10) = 50 clicks
Program Enroll | ln (0.005) / ln (1 – .01) = 527 clicks
So, on average, it takes over ten times as long to reach significance with the lower-funnel ‘Program Enroll’ than it does with the upper-funnel ‘Contact Form Fill’. Hence the volume edge of the upper funnel. For an intuitive explanation of this concept, see the section headed “The Volume & Monetization Rate Tradeoff” from Part 1.
The above calculator can also be extended to roughly quantify the percentage of your program that classifies as long-tail. The first step is as above: to calculate the “statistically significant click volume” for your program at large (or some subsets of it). Next, for the program (or those subsets individually), count the number of keywords with historical clicks above and below that threshold. Divide by the total number of keywords and there you have a good enough estimate of long-tail proportion for most practical purposes.
From Part 1 of this series (with a few edits to fit our sample data)…
“Think of the Average Monetization Rate as a measure of predictive power towards future revenue: the higher the rate, the more power packed. One ‘Program Enroll’, then, holds a lot more weight in this department than does one ‘Contact Form Fill’ (by, on average, a factor of [10] Similarly, one ‘Loan Application’ averages [20x] the predictive power of one ‘Contact Form Fill’.”
The more likely something is to turn into revenue, the more we want to preference it. Nice and simple. Time to put it all together.
In pursuit of the perfect Hybrid Metric, let’s start simple and then layer in complexity based on what we’ve learned.
Attempt 1
What if we just added the three conversions together? How would that sway the value rankings of our keywords?
Hybrid Conversion = Contact Form Fills + Loan Applications + Program Enrolls
Per 1000 clicks = 100 + 50 + 10 = 160 Hybrid Conversions
Here we must introduce the idea of an effective weighting. Doing a simple sum like this means that we’re weighting each conversion point equally (i.e. 33%). The volumes of each conversion, however, make the effective weighting very different: ‘Contact Form Fills’ account for 63% of the total whereas ‘Program Enrolls’ only account for 6.3%.
Effective Weighting = Individual Conversion Volume / Total Hybrid Conversion Volume
Well, given that ‘Program Enrolls’ are a lot more accurate to revenue than ‘Contact Form Fills’, we probably want them to factor in more heavily. As is, keywords that get us a ton of upper-funnel but not much beyond that are still ranking too high.
Attempt 2
If the Monetization Rate is a direct measure of accuracy to revenue, shouldn’t we incorporate that? If a ‘Program Enroll’ gets us ten times more money on average than a ‘Contact Form Fill’, then shouldn’t it be weighted ten times more?
Hybrid Conversion = (1.0 * Contact Form Fills) + (2 * Loan Applications) + (10 * Program Enrolls)
Per 1000 clicks = 100 + 100 + 100 = 300 Hybrid Conversions
All we’ve done here is directly applied our relative Monetization Rates as coefficients: 10%, 20%, and 100% become 1, 2, and 10. But remember, what’s important is the effective weighting. That comes out to 100 / 300 for each, or 33%. So now, we’ve inadvertently created a Hybrid Conversion whereby all three conversion points are effectively weighted evenly!
Attempt 3
We want our Monetization Rates to align with our effective weighting, so that – if a ‘Program Enroll’ is worth 10x a ‘Contact Form Fill’ – we’re treating them accordingly.
Hybrid Conversion = (0.25 * Contact Form Fills) + (1.0 * Loan Applications) + (25 * Program Enrolls)
Per 1000 clicks = 25 + 50 + 250 = 325 Hybrid Conversions
Sure, you can use coefficients less than 1. And scale them up or down all you want, as long as do so for all of them together – the relative amounts are all that matter. This time when we calculate our effective weightings we get:
25/325 = 7.7%
50/325 = 15%
250/325 = 77%
Notice: 77% is ten times 7.7% and about five times 15%, while 15% is twice 7.7%. Or, exactly our Monetization Rate differences!
Attempt 4
The final check here is to balance it out with our Frequency considerations. Is our new Hybrid making the long-tail too long? How long will it take to reach statistical significance? Our new metric might be a near-perfect representation of value, but is it too bottom-heavy to be useful?
We can gauge this by calculating the effective conversion rate of our new Hybrid Conversion, and then plugging that into our Statistical Significance Calculator.
Effective Conversion Rate = Sum of (effective weightings * conversion rates) = (.077 * 10%) + (.15 * 5%) + (.77 * 1%) = 2.3%
Statistically Significant Click Volume = ln(0.005) / ln(1 – .023) = 228 clicks
So, by our new Hybrid Conversion, it will take 228 clicks on a given segment before we know anything useful about the performance of that segment. Is that too many for tolerance? You’ll have to assess that in the context of your own program. If you want to slide the click threshold down, simply weight the upper-funnel conversion points a dash more relative to the lower-funnel ones.
Maybe you decide that looks like this.
Hybrid Conversion = (0.5 * Contact Form Fills) + (1.0 * Loan Applications) + (20 * Program Enrolls)
Perfect!
The only trouble in all this is that there’s no such thing as a perfect Hybrid Conversion anymore than there exists a perfectly predictable funnel. In lieu of precisely knowing the Conversion Rates and Monetization Rates of every keyword in our program, we speak in averages. We can say how much of our program is long-tail, but we can’t say if that’s too much or too little. And all those questions about your business? Those can get a tad mushy… For these reasons, Hybrid Conversions will always be a bit of an exercise in try, check, and revise.
In Part 1, we learned that Hybrid Conversions allow us to smartly differentiate between the values of program segments. Here in Part 2, we learned how to try them, how to check them, and how to revise them, so that you can start putting your SEM spend where it will make you more money.