
Technology
Basis Platform
Advertising Operating System
Communication Portal
Intelligent Collaboration
All Channel Activation
Activate Media on Every Channel
Consulting
Resources
The word "innovative" gets thrown around a lot in ad tech. But what does it really take to consistently deliver innovation that resonates with advertising clients?
Walter Geer shares how he empowers his team to keep innovation at the forefront of approaching client business. He also discusses his passions for mentorship, DEI, and connecting authentically with his growing social media network about important causes.
A growing, multi-location bank brand needed to strategically target prospects to drive application volume in a competitive and saturated market within the industry.
Grow application volume by 25% and improve cost per acquisition by 27% YOY.
The media activation & strategy team's first step was analyzing historical campaign performance to discover optimizations for flighting, partner selection and measurement. Next, audiences and product trends were examined for insights on future strategies. Digital strategies were aligned with traditional efforts to ensure a holistic measurement of their customer journey.
Applications: 130% increase in volume
CPA: 37% reduction in CPA vs. 27% goal
Target Audience: Built target audience based on consumer behavior
Education: Thought leadership prepared the client for future success in programmatic buying
~
VP of Marketing, Banking Application
"Partnering with Basis Technologies has allowed us to increase our bandwidth and stay nimble as our organization grows. I like the fact that we have a team of field experts who understand the goals of our business, dedicated to driving digital performance for our company. Their data-driven approach and learnings allow us to make decisions and strategic adjustments with confidence. Basis Technologies is no longer a vendor to us, they truly are a part of our team."
~
This is the second in an 11-part series of blog posts that focus on Basis Technologies' corporate guiding principles, and how those values show up in the workplace and in the lives of our people.
I founded Basis Technologies on 11 ideals—or guiding principles—to keep the company and the people in it on the right track as we achieve our business goals. One of the most overarching principles is our commitment to continuous self-improvement and personal growth.
Basis is committed to investing in the growth of our team members, while cultivating a culture of responsibility and accountability for everyone’s own self-development. As I think about my commitment to personal accountability and self-improvement, my DEI (Diversity, Equity & Inclusion) journey comes to mind.
Over the last few years, we increased our efforts to be a more diverse, equitable, and inclusive workplace. We have worked to strengthen the communities we work and live in, broaden our recruitment methods, and cultivate an inclusive workforce.
Sadly, our DEI outcomes have not been good enough to net the results we want. We must do more and get better at holding ourselves accountable. This isn’t to say that there has been no improvement. We’ve set goals around recruiting and hiring initiatives, have made investments in furthering opportunities for students from underrepresented groups, and have increased DEI education and resources for our employees.
But these efforts are only a start. Real DEI work requires long term effort and a deep commitment to continuous learning and improvement. As CEO, I’m determined to do what it takes to improve our representation and our eternal commitment to DEI. This begins with my own personal commitment, responsibility and need for self-development. Here are three lessons I’ve learned so far in my DEI journey.
As a CEO, I’m constantly working to educate myself. I’ve committed myself and my executive team to at least 15 hours of education focused around DEI per quarter. Recently we’ve read Blindspot: Hidden Biases of Good People and How to Be an Inclusive Leader: Your Role in Creating Cultures of Belonging Where Everyone Can Thrive.
Education on why and how diverse representation matters is important. Identify and communicate why diverse teams are important to your company. For example, diverse teams are important for Basis because we’re building an industry-changing product, we’re servicing diverse clients, and we’re building a responsible corporate culture that encourages and values creativity, innovation, and fresh ideas from everyone. We can’t be successful when we think small or with a narrow perspective.
We have work to do on representation. Currently, BIPOC (Black, Indigenous, People of Color) employees make up 16% of Basis team members living in the U.S. Our goal is to almost double this percentage in the next few years.
While BIPOC talent represented 27% of our U.S. new hires in 2020, we need to ensure that these numbers stay high throughout interview stages, hiring, and retention. We’re focusing on broadening where we search for talent as well as improving interviewing training and practices (e.g. blind resume reviewing) that help to address and minimize unconscious biases.
While it’s imperative to set goals, focus on metrics, and track data around representation, it’s important to remember that behind employee demographics and representation metrics are real people. Not only does representation matter to our intellectual, business, and innovation efforts, it also affects the mental and emotional load of what our employees are carrying into the workplace and how they are able to show up for work.
We’ve created a space for authentic conversations from a myriad of voices in a series called Basis Conversations. We're also proud of our employee-created and led Community Groups (Employee Resource Groups) that serve as safe spaces for support, education, and resources. Recently, our Parents Community Group and Black Excellence Community Group hosted a conversation about how to talk to kids about race.
We have more work to do in centering our support and listening to our employees’ experiences and needs. With the increase of violence against the AAPI (Asian Americans and Pacific Islanders) community, it became clear we need to do better at pausing, listening to, and supporting our AAPI employees. Many of us will never fully understand the daily lived experiences of our employees. We have work to do in educating ourselves about what our teammates are bringing to work and how to best support them.
DEI is in everyone’s best interest and is everyone’s responsibility at Basis Technologies. Studies from McKinsey & Company, Deloitte and Gartner consistently show that diverse teams across many vectors are more successful in meeting their goals and coming up with unique, innovative solutions.
But DEI work doesn’t start and end with recruiting and hiring. We certainly need to recruit diverse candidates, but far from being HR or Recruiting’s responsibility, it's critical managers and colleagues who take on the work of creating inclusive and equitable spaces through hiring and onboarding practices and on their teams every day.
Ensuring we have a diverse workforce is only a first step. The more important step is ensuring everyone has a positive experience and chooses to stay and grow with us. If BIPOC talent, LGBTQ+ community members, or other people within an underrepresented group don’t see, meet and connect with people similar to them within the organization, its difficult to feel included and part of the team.
Ensuring that we’re always showing and proving we care about each team member's growth, happiness and career progression is paramount to our success. This is everyone’s job at Basis.
In this spirit, we are now including an assessment around embracing diversity in every employee’s performance evaluation this year. We’ll be tracking participation in DEI focused trainings and educational opportunities. From here, we will begin linking our leaders’ performance outcomes to meaningful contributions to our DEI strategy and goals.
I look at DEI the same way I look at building an innovative product and platform: approach the issue with a challenger mindset, don’t buy into the way things have always been, and commit to consistent improvement at the macro and micro-level every day.
There’s never a point where we stop after reaching a certain goal—there is only progress. Our DEI work will never be over, even when we reach the initial goals we set for ourselves. It’s vital that we create and maintain a culture where everyone feels comfortable giving candid feedback, sharing experiences openly, and coming up with new and innovative ideas that we can continuously act on.
In addition to working towards progress in our own company microcosm, we need to be cognizant of how Basis can help create paths for underrepresented groups people to break into industries that have struggled to build diverse workforces. Our partnerships with organizations like CodeNation and The Boyd Initiative are small steps in the right direction.
We also must hold ourselves accountable to ensure that we have equality in both compensation and career paths. We have removed historical salary considerations from our interview process and have instituted an annual pay audit to assess parity among different demographics. In previous internal studies, we have done well relative to these metrics, but there are always ways to improve.
We will keep learning, striving for progress, and over-indexing on the amount of support and career investment we provide for our underrepresented groups in the technology and advertising industry. Our mission is to be both leaders and eternal learners in our respective industries to counter historical inequities and ensure we are a colorful and diverse team where everyone feels warmly embraced, included, and equal.
I want to thank the Basis team members whose passion has driven our DEI progress to date, including members of underrepresented groups and our Community Group members.
Digital advertising has come a long way since the first display ad in 1994. And as new technologies have emerged, so has interest in how and why ads are being shown to consumers.
Over the last several years, tracking methodologies that allow advertising technology suppliers to create targeting mechanisms have been subject to increased scrutiny. In response, technology developers and regulatory bodies have taken action in protecting and enforcing users’ right to privacy and choice.
Let’s take a look at some of the privacy-focused steps that tech companies and government bodies have taken over the past several years, building up to the expected “death” of third-party cookies by 2022:
In 2018, Mozilla released Enhanced Tracking Protection (ETP), a setting of Firefox 63 that allows users to block third-party cookies. A year later, the company made changes so ETP would only block known trackers and not all cookies—Mozilla found that blocking all cookies “leads to scenarios where some websites may not function properly." They took this modified approach to prevent “potential usability issues,” and users who preferred more protection and privacy could change the tracking settings from the default “standard” to “strict.”
Microsoft soon followed suit, and in 2019 introduced Microsoft Tracking Prevention (MTP). Like Mozilla’s ETP, MTP offers users multiple protection levels: Basic, Balanced (the recommended/default option), and Strict. MTP blocks third-party cookies from known tracking sites and, in strict mode, blocks calls to those sites. But unlike ETP, Microsoft does not offer a custom mode, and doesn’t behave differently between InPrivate or normal browsing.
And then, of course, there is Apple. With the release of Safari 13.1 in March 2020 and through updates to its Intelligent Tracking Prevention (ITP) privacy feature, Apple now blocks all third-party cookies in Safari by default. John Wilander, Security & Privacy Engineer at WebKit (Apple), explained that users were unlikely to notice any changes because ITP had already been doing some of this for several years. “It might seem like a bigger change than it is,” Wilander said, “but we’ve added so many restrictions to ITP since its initial release in 2017 that we are now at a place where most third-party cookies are already blocked in Safari.”
And with the release of iOS 14, Apple now gives users a prompt to opt-out of tracking, thus reducing the availability of the Identifier for Advertisers (IDFAs), a random device identifier assigned by Apple to a user's device. Advertisers have used this to track data so they can deliver customized advertising. The April 2021 release of iOS 14.5, specifically, brought with it a new privacy framework called App Tracking Transparency (ATT), which gives users more insight into how their data is used, how their online activity is tracked, and introduces an "opt in" environment on the iPhone when it comes to cross-app tracking.
Browsers aren’t the only bodies who've been reacting to users’ demands for increased privacy controls—governments in Europe and North America have been developing laws to protect consumer’s data. North America started with an opt-out approach, whereas Europe's stance has been stricter with an opt-in system.
In 2016, the European Union approved the General Data Protection Regulation (GDPR), which was put into effect in May 2018. The regulation governs the collection and processing of personal data of European member state citizens. Under GDPR, personal data that is used to offer goods and services, or to profile users, can only be collected for explicit, specified purposes, and the processing of that data must be compatible with those same purposes.
There are only a few very specific legal bases for processing personal data—most notably, through the consent of the data subject. In addition, data subjects have very broad rights, including the right to transparent information about the data collection and processing, the right to be forgotten (erasure of data), the right to object, and others.
The intention of the regulation is to give data subjects more control over their personal data: who can use it, how it is used, who it can be shared with, etc. All companies that interact with European end-users are obligated to comply with this law, regardless of that companies’ geographic location. As a result, advertisers need to ensure that their advertising activities are lawful under the GDPR when targeting EU member states in their campaigns. Advertisers that collect and process personal data, and who have determined that their activities fall within GDPR’s scope, need to be certain they have a valid legal basis (such as user consent) for doing so.
Privacy regulations have also come to the US—notably, when the California Consumer Privacy Act (CCPA) was signed into law in June 2018 and became effective in 2020. CCPA gives California residents new rights regarding their data, including the right to know what personal information a business collects about them and how it is used and shared; the right to delete personal information collected from them (with some exceptions); the right to opt-out of the sale of their personal information; and the right to non-discrimination for exercising their CCPA rights.
Building upon the CCPA right to request access to the personal information a business has collected about a person in the preceding 12-month period, the forthcoming California Privacy Rights Act (CPRA) expands this to include any information collected—regardless of when it was collected—unless doing so proves impossible or would involve a disproportionate effort. CPRA goes into effect January 2023, so the clock is ticking.
For digital marketers, these steps have led to a particular reckoning: how to operate after the death of the third-party cookie.
A third-party cookie, for the uninitiated or less-than-tech savvy, is a piece of code set by a website other than the one a user is currently on. This snippet of code is primarily used to identify and track visitors between websites and display more relevant ads.
These cookies have helped media buyers execute targeting tactics so their ads are shown to the right person, in the right environment, at the right time—via audience targeting, retargeting, geo-based retargeting, cross-device targeting and tracking, and frequency capping. Additionally, cookies have facilitated a variety of attribution measurements, such as foot traffic/walk-ins, app installs, and conversions via click-through and view-through.
So, what does the demise of the third-party cookie mean for digital marketers, and how should they proceed moving forward? Check out Centro’s guide, “Embracing the Identity Crisis,” to learn more about some of the potential solutions and to see why, in the words of Centro Founder & CEO Shawn Riegsecker, this is in fact "an opportunity” for the advertising industry.
Consumers shifted from traditional media to digital media swiftly in 2020—and the data shows that this trend is set to stick around. Download the infographic below to view the average time U.S. adults spend with digital media and online trends that are here to stay.
Monster is a global online employment solution for people seeking jobs and employers who need great people. With two sides of the equation, candidates looking for quality jobs and employers looking to fill open roles, Monster has many different targets and initiatives. They have expanded from their roots as a "job board" to a global provider of a full array of job seeking, career management, recruitment, and talent management products and services.
Early in the relationship, Basis Technologies provided media strategy & activation services support to the Monster media team. As Monster’s business strategically evolves, they’re on a longer-term path to self-service which will bring the media execution fully in-house. Both companies know it will take time and training to transition the work, but Basis Technologies encourages clients to do what is right for their business, including moving fluidly between solutions like managed services and self-service. Sr. Director of Global Media at Monster, Shaun Farrar said, “[Basis Technologies has] been really open in saying ‘when you’re ready, we’re ready. We’ll customize our approach with you.’”
“Basis has made a significant impact on my team’s ability to free up their time to focus on strategy and insights,” said Shaun Farrar, Sr. Director of Global Media at Monster.
Shaun and team specifically find significant value in the delivery integrations and reporting features. “Basis essentially consolidates multiple platforms so you don’t have to log into four or five different platforms to pull reports and aggregate them—Basis does it for you. Rather than spending so much time pulling reporting, Basis gets rid of that friction and wasted time and really allows you as a marketer to dig into to the data and come up with sound strategy. Basis enables you to better use your time."
Shaun Farrar, Monster’s Sr. Director of Global Media, said it best: “There really is not another Basis. You can work with any other DSP, but they are so limited in their scope that it becomes prohibitive. Basis not only has display and video capabilities and solutions, but also can help with social, search, and the entire digital ecosystem. That’s incredibly attractive to a brand that has a small team in-house that activates globally and across multiple channels. I put Basis in a category by themselves for that reason.”
~
Shaun Farrar Sr. Director of Global Media Monster:
"Basis Technologies is an extension of our team. They improve how we work each and every day. We rely upon them immensely. They've got really smart people, very strategic, and very sound from an executional standpoint."
~
To say that retail has changed in the past year would be…well, a grave understatement. Since the COVID-19 pandemic upended commerce as we knew it, retailers have had to pivot hard toward digital. Retail marketers, in turn, have had to double down on their digital marketing efforts, investing their time, money and creativity into taking full advantage of these channels.
Here are three things retail challenger brands should know if they want to make the most of their digital marketing efforts:
For most of us, social sits at the center of our online experience. It’s perhaps unsurprising, then, that we're seeing more and more shopping (and sales) taking place right within our social apps.
Social commerce has exploded since the start of the pandemic, and analysts say it will surpass $50 billion annually by 2023—an astonishing 100% growth from where those numbers were in 2020. All the major social apps now have some level of shopping enablement, and users can move from the discovery phase to the purchase phase the blink of an eye—especially for lower cost or aspirational items. The overall impact of this trend on a given retailer will, of course, depend on its target audience, but all retail brands should be looking to take advantage of these opportunities.
As challenger brands have innovated in the digital space, established retail brands have taken notice and begun to borrow some of their tricks. Nike, for instance, has refocused much of its energy on direct-to-consumer efforts, which now make up nearly a third of their sales. This is a huge uptick that has tremendous value both in terms of profitability and first party data, not to mention customer loyalty.
Challenger brands, in turn, should take note of what they can learn from the success of those larger companies when it comes to driving consumer behavior. One way to do this, notes Centro’s Page Kelley (Group VP of Client & Media Services, South), is introducing a subscribe and save-type model into your direct-to-consumer experience, which can be a great way to get “stickiness” with your customers. As category lines continue to blur and digital continues to level the playing field, the differences between challenger brands and established retailers will grow increasingly muddled as they borrow pages from each other's books.
When challenger brands are planning out their campaigns and media strategies, it’s important they stay agile and create multiple touch points—across multiple channels—along the customer journey. Modern consumers don’t tend to operate in just one space, so brands need to meet their consumers wherever they are and then make the ensuing buying process as easy as possible, removing as much friction as possible between the first discovery/impression and the actual add to cart. Taking such a holistic view of the customer journey can help challenger brands create a better customer experience and, ultimately, increase conversion rates.
Want more insights on what challenger retail brands can do to up their digital game? Check out our Centro Institute webinar: Vertical Viewpoint: Conquering Challenges as a Retail Brand.
Grace Briscoe is SVP of Candidates and Causes at Basis Technologies
The 2020 U.S. elections were the most unique of our generation -- bringing record turnout, billions of dollars in marketing and two intense runoffs for control of the U.S. Senate.
More than 400 campaigns for state, local and national races managed their digital ad buying through Basis' intelligent process automation platform, encompassing more than $100 million spent across display, video, native, search and social media.
Basis' experience in this category has been honed by more than a decade working with candidates and advocacy groups at all levels, from Presidential to local elections. Our activity in 2020 gives us a diversified view on how digital media was utilized and what trends have emerged.
This report is the second time Basis researched how U.S. elections spent on digital ads. The first report (https://basis.com/blog/blog-midterm-adtech-mvps) unveiled the digital MVPs that delivered winning strategies and tactics of the 2018 midterms. At the time, programmatic buying revealed itself as a tactic of choice offering speed and agility to launch campaigns, optimize on the fly, and reach audiences on high-performing media. Now with data from another cycle, the game-winning playbook seems to be set for aspiring 2022 midterm campaigns. This is fortunate because they’ve got less than a year to prepare.
Section 1: Programmatic Advertising Wins the Votes (Dollars) Again
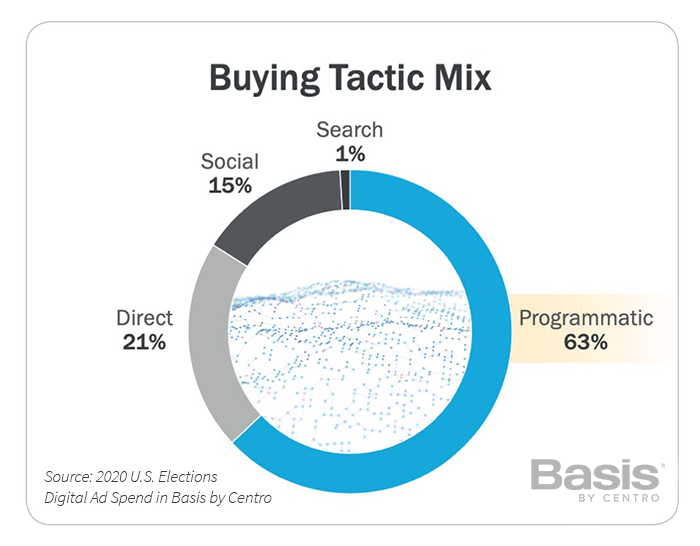
The interest in programmatic advertising for political campaigns aligns with the general market trends across the industry—nearly two-thirds of digital ad inventory was sold programmatically in 2H 2020, according to eMarketer (subscription required).
Connected TV helped drive share gains for both programmatic and direct buying, as advertiser interest and inventory availability continually increased across the digital ecosystem. The share of social advertising declined, with Twitter’s political ban and YouTube’s restrictions having a major effect. Additionally, Facebook’s shifting policies and political ad ban immediately before Election Day (and then after) diverted a big chunk of spend to other channels, as campaigns showed immense ad activity in the final days before ballots were counted. The next election will likely see an even greater dominance of programmatic. The question is what other budget bucket will it take from?
Section 2: Challenger CTV Flexed Some Muscle; Watch Out in the Midterms
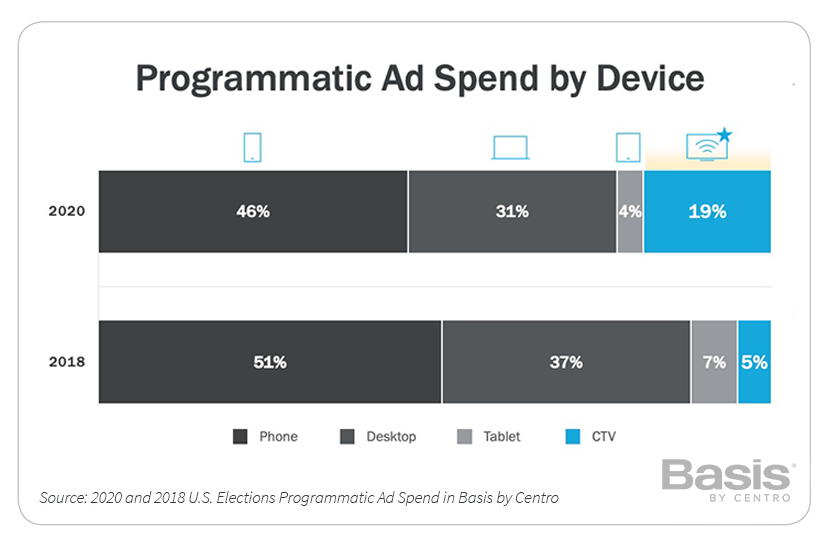
Basis' Spring 2020 political advertiser survey indicated that CTV was the most promising development among political marketers (63%), which bore out in spend. 2020 saw nearly a 3x increase in portion of overall programmatic spend allocated to CTV over 2018.
Among share of impressions, CTV only increased from 3% to 6% of overall impressions. The delta between spend and impressions share growth speaks to the premium that advertisers pay for quality CTV placements: eCPMs for CTV averaged 3.5X that of other platforms/devices. Advertisers have determined that the format – typically unskippable and on the “big screen” – is worth the premium, carrying the emotional power of TV combined with greater targetability.
Besides programmatic, the CTV surge also contributed to many larger trends in digital video and direct buying. Much of this interest from marketers aligns with the growing audience turning to this digital channel as they were stuck at home because of the COVID-19 pandemic.
Section 3: Video Ads Gained Super Majority Control of All Ad Spend
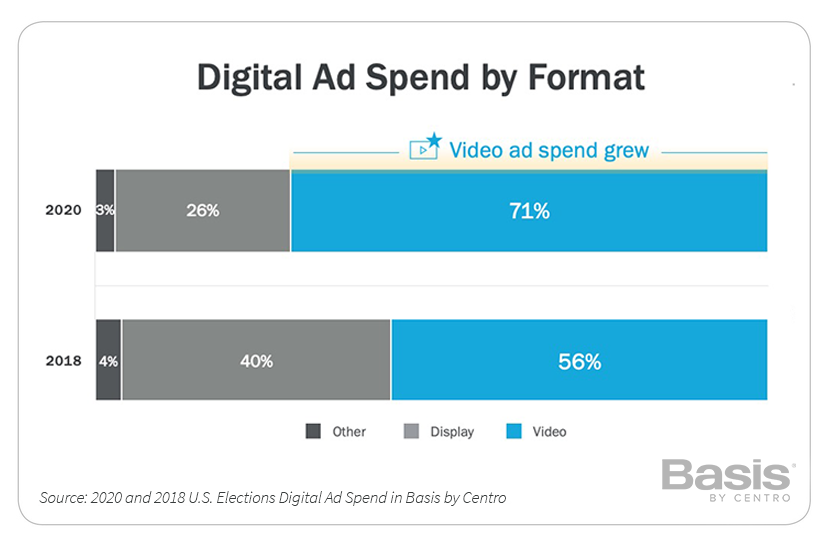
Video receives the most digital ad investment from political campaigns. This is boosted by the usage growth trends for programmatic advertising and in CTV interest. Because most political campaigns already prioritize TV spot production as the central element of creative strategy, it’s natural to utilize those assets in digital channels. Transitioning a linear ad to CTV is a given. Doing the same for an ideal mobile or a desktop experience requires some extra work that can be a challenge for campaigns. The variances in screen-size and user mindset necessitate shorter video lengths for these digital channels. And often, less-highly produced “raw” video ads generate greater impact than repurposed :30 TV spots.
Section 4: Facebook and YouTube Restrict Political Ads, Yet Still Top Direct Vendors List

Direct buying provides unique value for campaigns, delivering guaranteed reserved inventory within in-demand content, and delivering ad experiences that are not available through biddable channels.
Direct buying takes on many forms, as demonstrated by the top three. Facebook delivers an automated self-serve experience, though it’s become less user-friendly for political buyers because of additional restrictions and multi-step ad approvals. Hulu provides a white glove experience through a salesperson and service team. YouTube offers a mix of both, though it was hampered by Google’s political targeting restrictions. Nevertheless, these three again showcased their command in political advertising for the past few years, despite their own restrictions.
The new entrants to the top 15 are another indication of CTV’s influence in political advertising. When considering the relatively limited amount of CTV inventory, factored by the massive amounts of spending leading up to election day, vendors offering these ad experiences capitalized on a time of high demand and low availability. Additionally, it’s fair to assume that these companies capitalized on the challenges of political ad targeting on YouTube.
Dropping out of the top 15 were notable publishing brands operating regional and local newspapers, such as McClatchy, Tribune, Gannett and Lee Enterprises.
Pandora’s drop (4th in 2018 to 15th in 2020) as well as Spotify’s complete political ad suspension illustrate the significant decline in digital audio for political campaigns.
Section 5: Unprecedented Elections = VERY Precedented Ad Spend Timing

Despite the noise and dialogue around early voting (in-person or mail-in ballots as much as a month before election day), half of ad budgets were used within 30 days before Election Day. Although many of those campaigns were driving turnout efforts, the fact that 25% of budgets were reserved for the last week of October showed the focus on last-minute GOTV (Get Out the Vote) impact. Considering the record turnout of voters overall, we conclude that many early voting efforts accomplished their objectives, and likely added to high turnout on Election Day.
The Georgia runoffs infused new spending and activity that was not accounted for in most pre-Election ad spend forecasts. Although it didn’t boost November spending heavily, the December spending levels ran very close to February numbers during the thick of the Democratic primary sprint to Super Tuesday.
The data suggests that during a time when the country is heavily polarized and individuals seem to have near certainty on who they would vote for, the biggest challenge for the political marketer is to ensure potential voters take action at the ballot box.
Section 6: Sound Digital Strategies Correlate with Winning Campaigns
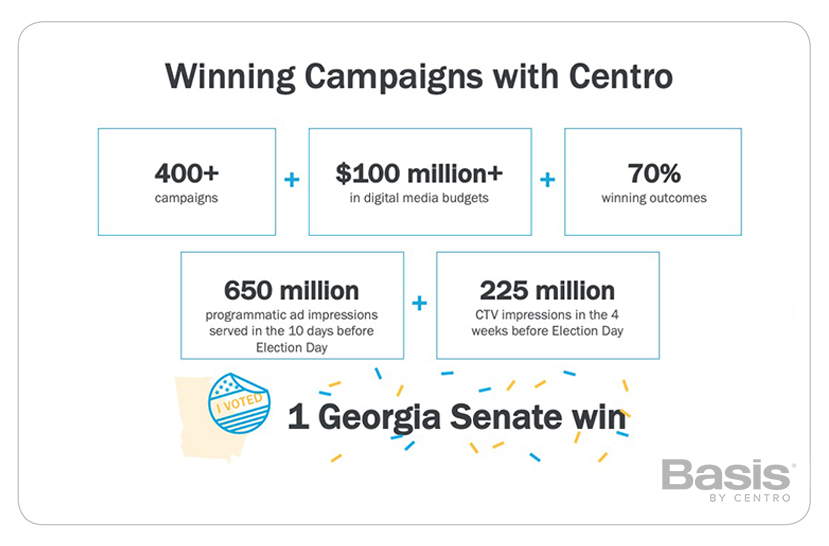
With high advertising volume reserved for the ending stages of the elections (and the additional activation for the runoffs), Basis was able to process, before Election Day, 650 million programmatic ad impressions in the final 10 days and 225 million CTV impressions in the final four weeks.
Frequency, exposure, recency and precision were key to driving turnout -- leading to 70% winning outcomes for Basis' campaign partners.
What Basis Clients Say
“We’re able to run our own highly targeted digital advertising campaigns in Basis with speed and flexibility that keeps our clients coming back time and again. It has also cut the time we spend on billing and reconciliation by half.” – Managing Partner, Public Affairs Firm
“Basis' team provides incredible support and scale during the heat of election season - we couldn't have pulled it off without them.” -- Vice President, Democratic Political Consultant
“Basis gives us the ability to buy sophisticated digital tactics with speed and scale, and increased communication and collaboration across all areas of digital buying. If you’re not working with Basis, you are making a big mistake.” -- Managing Director, Republican Digital Buying Agency
Georgia Runoffs on Your Mind
The Georgia runoffs culminated Basis' political advertising work in 2020. We collaborated with our agency client to win a U.S. senate seat through a combination of activating voters early, deploying CTV advertising at scale, engaging social media audiences through alternative platforms, and reaching a diverse electorate. Georgia was the highest turnout for a senate runoff in the state’s history, with our Candidate being named one of the newest U.S. senators. According to the Fox News Voter analysis, a key factor was the increased turnout of Black voters, which made up 32% of the runoff votes.
About Basis' Candidates + Causes Group
For more than a decade, Basis' technology and services have been trusted by agencies and consultants in politics, public affairs, and advocacy. Basis' Candidates + Causes team has collectively worked with 1500+ political campaigns and independent expenditure committees, and 2000+ issue advocacy advertisers over the past 15 years. Our proficiency for driving perception in government, in the public sphere, or among specific audiences is a differentiated and valuable asset in this field. Basis is headquartered in Chicago with 44 offices covering North America, South America and Europe, including a Washington, D.C., hub for its Candidates + Causes team.
At Centro, we know that keeping up with the trade pubs and latest trends can be tough and time-consuming. To make that easier, we’ve compiled all the articles, reports, and other bits of awesomeness you may have missed, but should definitely read. Enjoy our latest list below!
Magna Predicts Faster Than Expected Rebound [:03]
Magna’s latest US ad spend forecast paints an optimistic picture for the ad industry. With a quicker-than-anticipated economic recovery, supported by a new stimulus package, a decline in COVID rates, and the return to normal sporting events, revenues are expected to increase 6.4% YoY to $240 billion. Digital will capture two thirds, or 67%, of total advertising sales.
U.S. Ad Economy Contracts 7.3% in February [:01]
The U.S. ad economy contracted for the second consecutive month in February, dropping 7.3% from February 2020, according to a MediaPost analysis of data from Standard Media Index's U.S. Ad Market Tracker. In terms of media, digital continues to be the most resilient, actually posting an 18% gain over February 2020, while the national TV advertising marketplace declined 26.7% year-over-year.
When Precision Meets Persuasion, It's Time To Rethink Marketing [:03]
Marketers have struggled to think about the combination of brand and performance as unifying the strategic intent of precision and persuasion marketing. For precision and persuasion to come together, the emotional needs, functional needs, and transactional requirements of shoppers/audiences must be addressed simultaneously. This has required agencies to retool their approach, while in-house agencies have moved nimbly in response to the customer lifecycle.
Finally Some Clarity Around Google Ads’ Latest Privacy Announcements {:08]
IAB Tech Lab breaks down the recent Google privacy announcements for Users, Publishers, Advertisers, and Non-Google Ad Tech, as key granular identifiers will soon disappear. Also, be sure to read Centro's official POV on Embracing the Identity Crisis, here.
In 2020, Two-Thirds of Google Searches Ended Without a Click [:05]
In further proof of Google’s dominance, last year the search giant had more than 91% of the global market share worldwide, and over 87% in the US. From January to December 2020, 64.82% of searches on Google (desktop and mobile combined) ended in the search results, without users clicking to another web property. It's also worth noting that Google controls more than 95% of search advertising and over 50% of display ads in the US.
The Infinite Dial 2021 [:04]
Edison Research’s latest report, which acts as a “barometer on digital audio and other digital media consumption,” shows huge strides in podcast listening with approximately eighty million Americans–28% of the U.S. 12+ population–now being weekly podcast listeners, a 17% increase over 2020. Other insights show the increase in smart speakers, with one-third (33%) of Americans 12+ (approximately 94 million people) now owning a smart speaker, an increase of 22% from last year.
Why Advertisers Are Spending More on Podcasts [:02]
Advertisers are increasingly investing in podcasts as the pandemic boosts their audience, according to a report from Advertiser Perceptions. Marketers feel the medium is safe and has strong target audience potential, with a survey showing 56% feeling the pandemic has made podcast advertising more important, and 63% listening to podcasts themselves at least once a week.
The Buzzy, Chatty, Out-of-Control Rise of Clubhouse [:32]
What do you know about Clubhouse, the invitation-only audio social network that's skyrocketed in use since its launch in April 2020? Learn all about the rise of this phenomenon in Wired.
An Open Letter to Targeted Online Advertisers [:03]
With the stress of a cookieless future looming before us, marketers need a dash of humor. This piece of satire is funny because it’s true (or at least we hope it is!).